Pozzolanic activity of argentine vitreous breccia containing mordenite
V. L. Bonavettia, V. F. Rahhala, F. Locatib, E. F. Irassara*, S. Marfilc, P. Maizac
a. Facultad de Ingeniería, CIFICEN (UNCPBA-CONICET-CICPBA), Olavarría (Buenos Aires, Argentina)
b. CICTERRA (CONICET-UNC), (Córdoba, Argentina)
c. Departamento de Geología, CGAMA (CIC-UNS), Bahía Blanca (Buenos Aires, Argentina)
* firassar@fio.unicen.edu.ar
| |
ABSTRACT
A vitreous breccia with variable amount of mordenite was studied for its use as pozzolan. The raw material was characterized by optical and scanning electron microscopy (SEM), X-ray diffraction (XRD), and the zeolite content was estimated by the methylene blue staining technique. After being ground, physical characteristics, cation exchange capacity (CEC), pozzolanicity, and the compressive strength activity index (SAI) were determined. The staining technique and the CEC measurement were used to evaluate the average content of zeolite. The vitreous breccia has pozzolanic activity after 7 days, the water demand increases slightly, and its addition stimulates the early hydration of portland cement. At later ages, the pozzolanic reaction around the grains, as revealed by SEM studies, improves the compressive strength of blended cements having a SAI > 0.85 at 28 days.
|
| |
RESUMEN
Actividad puzolánica de una brecha vitrea argentina que contiene mordenita. Se estudió una brecha vítrea con cantidad variable de mordenita para su uso como puzolana. El material se caracterizó por microscopía óptica y electrónica de barrido (MEB), difracción de rayos X (DRX) y el contenido de zeolita se estimó mediante la técnica de tinción por azul de metileno. Luego de su molienda se determinaron las características físicas, la capacidad de intercambio catiónico (CIC), la puzolanicidad y el índice de actividad puzolánica a compresión (IAP). La técnica de tinción y la determinación de la CIC se utilizaron para evaluar el contenido promedio de zeolita. La brecha vítrea tiene actividad puzolánica después de 7 días, la demanda de agua aumenta ligeramente y su adición estimula la hidratación temprana del cemento portland. A edades tardías, la reacción puzolánica alrededor de los granos, observada mediante MEB, mejora la resistencia a la compresión del cemento mezcla alcanzando un IAP > 0,85 a los 28 días.
|
1. INTRODUCTIONTOP
The cement industry produces a large volume of CO2 emissions, which poses a challenge to commercial cement manufacture. According to the UNEP report (1), a viable way to reduce greenhouse gas emissions is to increase the amount of supplementary cementitious materials (SCMs)
with low CO2 emissions and locally available as partial replacements in cementing materials with an equivalent or better performance.
Natural pozzolans that only require a grinding process for their use as SCM are considered good candidates to achieve this goal (2, 3).
Pozzolans of volcanic origin have been used as hydraulic binder since ancient times, and thereafter, as SCMs in concrete worldwide
(4). They are composed of vitreous or poorly crystalized materials that can form coherent or incoherent deposits (5) and can undergo diagenetic or low-grade metamorphic processes with subsequent zeolitization (6).
Zeolites are three-dimensional, microporous, crystalline solids with a well-defined structure. They are characterized by a framework of linked tetrahedral (Si,Al)O4 containing open cavities in the form of channels and cages occupied by water molecules and extra-framework cations that are commonly exchangeable (mainly Ca, Mg, Ba, Na, K and subordinate Fe, Sr, Li, Be, Cs, Cu, Pb) (6, 7). They exhibit high cation exchange capacity (CEC) that basically depends on the substitution degree of Al3+ by Si4+ in the structure. Due to their open porous structure, the water molecules come off easily when they are heated, giving a continuous dehydration curve. This process can be reversible (partially or totally), so the structural porosity and the channels can be refilled with water or a wide variety of other substances, conferring a high absorption-desorption capacity to these materials (8). This selective process mainly depends on the zeolite structure and the pore size and molecules, so they are used in different applications (9).
Volcanic zeolite-rich pozzolans are very heterogeneous, so the characteristics and properties of both the raw material (such as mineralogy, texture, chemistry, crystallinity, grain size, morphology, etc.) and the zeolite-bearing material (zeolite vs. glass proportion, particle size distribution, bulk chemistry, CEC, specific surface area, etc.) should be correctly assessed by different techniques. Knowing these heterogeneities is essential as they can affect the pozzolanic activity (10) and the water demand of the material, and ultimately, the properties of fresh and hardened concrete (11-18). In addition, they can accelerate the early hydration of portland cement (15) and contribute to the formation of additional hydrates (12, 19).
Natural zeolites (mainly zeolite-rich materials) are widely used in the cement industry, especially in China (20). Different studies have shown that when used as SCM in replacement of part of the cement, concrete durability can be improved
((21) and references therein). In Argentina, zeolites are recognized in different geological environments, mainly of a diagenetic or hydrothermal origin, but they are commercially available in the province of La Rioja only (22). Raggiotti et al. (23) studied a clinoptilolite-rich zeolitized tuff from the province of La Rioja as partial replacement of cement (0% to 20%).
The material used is heterogeneous in size and their results indicate that it has good performance at 20% of replacement.
In addition, Locati et al. (24) found that finely ground, this material can be used as inhibitor of the alkali-silica reaction (ASR).
In this paper, a zeolitized vitreous breccia (ZVB) from the province of Mendoza (Argentina) is characterized before and after being ground to evaluate its potential use as SCM. Its pozzolanic activity is investigated by several tests. Furthermore,
the role of mordenite-type zeolite and the glass content in this breccia in pozzolan hydration is analyzed by X-ray diffraction
(XRD) and scanning electron microscopy–energy dispersive X-ray spectroscopy (SEM-EDS) techniques.
2. MATERIALS AND METHODSTOP
2.1. Raw zeolitized vitreous breccia (ZVB)TOP
The raw ZVB was extracted from an outcrop located in the south of the Mendoza province (Argentina). It is light green to whitish and has a small grain size. The mineralized sector is ~200 m long and 6 to 10 m wide, with the base covered and the top exposed or partially covered by different materials.
Petrographic studies were done on thin sections under parallel and crossed nicols (//N, XN) using an Olympus B2-UMA trinocular petrographic microscope. Morphological studies were performed with a LEO EVO 40-XVP SEM on gold-coated samples working at 10 kV. Additional studies were carried out on carbon-coated fractured surfaces and polished thin sections (abrasive size up to 1 μm) with a Carl Zeiss high resolution FE (Field Emission)-Σigma SEM-EDS microscope, working at 8 and 15 kV for images and microanalyses, respectively. Secondary electron (SE) images and backscattered electron (BSE)
images were obtained. XRD analyses were performed on Rigaku D-Max III-C, with Cu-K1,2 (=1.541840 Å) radiation filtered with a graphite monochromator operating at 35 kV and 15 mA. Patterns were recorded on ground whole rock (in agate mortar), from 3 to 60° 2 (0.02° 2 step and a counting time of 2 s per step).
Due to the irregular mineralization of the rock, the zeolite content was estimated by the following staining technique. One sample of the altered sector was cut and polished, obtaining a slab measuring 30 25 mm and 10 mm in thickness. It was immersed in 0.01 N methylene blue solution for two minutes. After this treatment, photomicrographs were taken (30x magnification) under a stereomicroscope covering the total surface of the slab. Finally, the percentage of the stained area (zeolites are colored due to their CEC) was determined for each image with ImageJ software (25), and the average value was calculated for the whole slab.
2.2. Characterization of the ground ZVBTOP
A representative ZVB sample was processed in a laboratory jaw crusher to obtain particles smaller than 4.75 mm. Two kilograms of the crushed sample were dried at room temperature and ground in a laboratory ball mill until less than 12% was retained on 45 mm sieve. After grinding, the particle size distribution (PSD) and its parameters (d90, d50 and d10) were obtained by a laser diffraction granulometer (Malvern Mastersize 2000) with dry dispersant medium. The material retained on 45 μm sieve by the wet method (26), the relative density (27) and the Blaine specific surface area (28) were also determined.
The chemical composition of the ground ZVB was determined by inductively coupled plasma emission spectrometry (ICP-ES) in ACME Laboratories, Canada (LF200 procedure). Additionally, it was characterized by simultaneous differential scanning calorimetry and thermogravimetric analysis (DSC-TGA) and Fourier transform infrared spectroscopy (FT-IR). DSC-TGA was performed with a TA Q600 analyzer under inert atmosphere at a heating rate of 10 °C/min from room temperature up to 1000 °C. The FT-IR spectrum was recorded on a Nicolet 520 FT-IR spectrometer using 1 mg pressed pellets of the raw material dispersed in 100 mg KBr. For each spectrum, 100 scans were recorded in the 400–4000 cm−1 spectral range with a resolution of 4 cm−1 in transmittance mode.
The CEC and exchangeable cations (in solution) were determined in LANAQUI laboratory (Argentina). The sample was digested using nitric acid (29). Saturation with ammonium acetate was used to obtain the CEC. The chemical determinations were carried out with an Inductive Coupling Plasma Atomic Emission Spectrometer (ICP-AES), Shimadzu 9000 (30).
2.3. Performance of the ZVB as SCMTOP
The ZVB-performance was assessed on blended cement containing an ordinary portland cement (OPC) with 25% by mass replacement as required by the IRAM 1654 standard for pozzolan (31). The chemical composition of OPC determined by X-ray fluorescence (XRF) is given in Table 1, and its mineralogical composition reported by the producer was C3S = 57.8%, C2S = 13.7%, C3A = 3.0%, C4AF = 14.2%, gypsum = 5.0% and limestone = 4.5%. The strength class of OPC was 40 (standard compressive strength > 40 MPa at 28 days).
Table 1. Chemical composition of OPC.
| |
Chemical composition (weight %) |
| SiO2 |
Al2O3 |
Fe2O3 |
MgO |
CaO |
SO3 |
Na2O |
K2O |
LOI* |
| 20.47 |
4.20 |
4.46 |
0.56 |
60.48 |
1.90 |
0.05 |
1.07 |
3.26 |
| *LOI: loss on ignition |
The minislump test (32) was used to determine the flow and the flow loss on the cement paste. After standard paste mixing, the minicone placed on a glass plate was filled with the mixture and carefully lifted to allow the paste to flow on the glass. After 30 s, two orthogonal spread diameters of the pad were measured and the average was calculated. The paste remaining in the bowl was remixed every
15 min to avoid bleeding, and the minislump was measured at 30, 60, and 120 min.
The heat and cumulative heat release rate during cement hydration was measured in a conduction calorimeter operating under isothermal conditions at 20 °C for 48 h. The paste was prepared using 20 g of cementitious material in a small plastic bag carefully homogenized. The bag and mixing water were placed into the calorimeter until thermal stabilization, and then the cement was mixed with 10 g of water by hand for 30 s, with a water-to-cementitious materials ratio (w/cm) of 0.50 by mass.
The bag was sealed, carefully placed in the calorimetric cup, and the measurement was started immediately.
For the Frattini test (33), 15 g of OPC plus 5 g of ground ZVB were mixed with 100 ml of boiled distilled water in plastic containers. Sealed containers were stored for 2, 7, 28 and 90 days at 40 °C. At test time, samples were vacuum filtered through paper, and the filtrate was analyzed for [OH−] by titration against dilute HCl with methyl orange indicator and for [Ca2+] by pH adjustment to 13, followed by titration with 0.025 M EDTA solution using murexide indicator. For this test, the mineral addition is considered active when the [CaO] and [OH−] determined in the supernatant solution are located below the solubility isotherm of Ca(OH)2 in alkaline solution at 40 °C.
The strength activity index (SAI) was determined as the ratio between the compressive strength of the OPC+ZVB and that of the OPC mortar curing at room temperature (34). The compressive strength was determined on prims (40 × 40 × 160 mm) made with standard EN 196-1 (35) mortar (w/cm = 0.5 and cement:sand = 1:3). Prior to casting, the flow test was carried out according to ASTM C1437 (36). Specimens were cured for 24 h in the molds in fog room, and thereafter demolded and submerged in tap water at 20 ± 1 °C until the test ages. At 2, 7, 28 and 90 days, the compressive strength was determined on three specimens (six values) using an INSTRON 33R4485 test machine. The mean value, the dispersion and the SAI were calculated. According to EN 450-1 standard
(34), fly ash behaves as pozzolan when the SAI is higher than 0.75 at 28 days and higher than 0.85 at 90 days.
At 90 days, a slice of standard mortar specimen containing blended cement was studied by SEM (see LEO EVO equipment in section
3.1) operating at 20 kV. A carbon-coated polished thin section was prepared (abrasive size up to 1 μm) and studied by BSE images and mapping mode (Si, Ca, Al, K, Na, Fe, Mg, S) to analyze the components of the cement paste, and line profile mode
(Si, Al, Ca, Na, K) to determine the chemical variation in the interfacial transition zone (ITZ).
The hydration compounds were determined on pastes made with w/cm of 0.5 and cured in sealed plastic bags at 20 °C for 2, 7,
28 and 90 days. At test time, the paste was crushed, immersed in isopropyl alcohol to stop the hydration, and the non-evaporable water (Wn) was determined by using the procedure proposed by Powers (37). Other paste fragments were carefully ground in an agate mortar immersed in isopropyl alcohol and immediately measured by XRD analysis using the same equipment mentioned above.
3. RESULTSTOP
3.1. Raw ZVB characterizationTOP
Petrographic studies show that ZVB is heterogeneous, with vitreous sectors slightly zeolitized in the upper part of the outcrop and other sectors strongly altered to zeolite, sometimes with good crystallinity (Figure 1a), which predominates in the lower sector of the outcrop. In the former, fluidal structures (with tubular microvesicles) and perlitic-spherulitic texture can be recognized (Figure 1b). Generally, more altered sectors are associated with zones of breccias of high permeability (Figure 1c). The heterogeneous reddish to brown coloration of some sectors is attributed to the presence of iron oxides/hydroxides.
A great percentage of the vitreous material shows anisotropy (partially crystalline), although mineral phases cannot be easily identified by this methodology. In these sectors, some fibrous zeolites (~50 μm long) with radial growth are recognized, although zones with very fine grain size (< 10 μm) predominate (Figure 1d). As accessory phases (< 1%) K-feldspar, plagioclase, clay minerals and prismatic zeolite were identified.
|
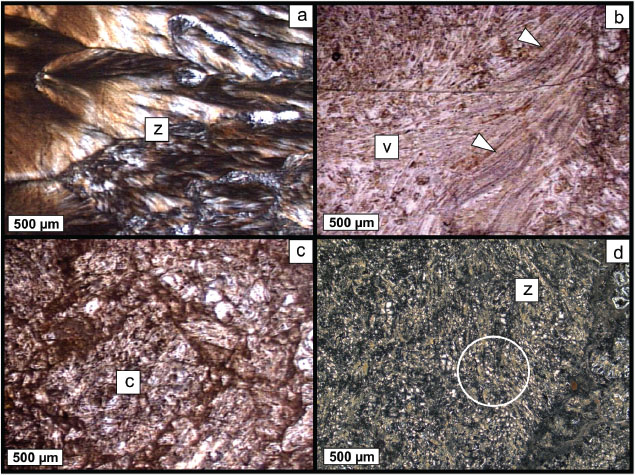 Figure 1. Photomicrographs of ZVB. a) Well-developed zeolite-rich zone (XN). b) Fluidal texture (arrows) in a volcanic glass-rich sector (//N). c) General texture of ZVB with fragments of zeolitized and partially altered volcanic glass (//N). d) Detail of a devitrified, altered sector in ZVB. Radial fibrous zeolites in a partially crystalline fine-grained mass can be observed (circle, XN). (z: zeolite-rich sector; v: volcanic glass-rich sector; c: clasts of ZVB). Figure 1. Photomicrographs of ZVB. a) Well-developed zeolite-rich zone (XN). b) Fluidal texture (arrows) in a volcanic glass-rich sector (//N). c) General texture of ZVB with fragments of zeolitized and partially altered volcanic glass (//N). d) Detail of a devitrified, altered sector in ZVB. Radial fibrous zeolites in a partially crystalline fine-grained mass can be observed (circle, XN). (z: zeolite-rich sector; v: volcanic glass-rich sector; c: clasts of ZVB).
|
|
SEM observation shows zeolite-rich sectors over volcanic glass. Also, well-developed fibrous zeolite (Figure 2a) is scarce and mainly associated with high permeability sectors (cracks and cavities), while zeolite of small grain size
(≤ 100 nm) and with no obvious habit (Figure 2b) is the most distributed phase replacing the vitreous material. The texture is mottled (Figure 2c) with relicts of volcanic glass (light gray) in a fine-grained mass of mordenite (dark gray) (Figure 2d). In some sectors, veins of K-feldspar (white) are also observed crosscutting the rock texture. Table 2 lists the EDS analysis composition of the volcanic glass and the zeolite (spots 1 and 2 in Figure 2d, respectively).
Table 2. Chemical composition (%) of volcanic glass (1: spot analysis in Figure 2d), mordenite (2: spot analysis in Figure 2d) obtained by FE-Σigma SEM-EDS, and bulk ground ZVB by ICP-ES. Mn, Cl, S and P values are below the detection limit in the three analyses.
| |
Volcanic glass (1) |
Mordenite (2) |
Ground ZVB |
| SiO2 |
69.48 |
71.26 |
69.27 |
| Al2O3 |
12.25 |
10.60 |
10.93 |
| Fe2O3 |
bdl |
bdl |
0.74 |
| MgO |
0.64 |
0.00 |
0.27 |
| CaO |
3.02 |
2.85 |
2.61 |
| Na2O |
0.46 |
1.77 |
1.43 |
| K2O |
2.67 |
1.73 |
2.18 |
| BaO |
0.70 |
0.00 |
bdl |
| TiO2 |
bdl |
bdl |
0.09 |
| LOI* |
- |
- |
12.30 |
| H2O** |
10.78 |
11.79 |
- |
bdl: Values below the detection limit of the equipment.
*LOI: loss on ignition
**H2O: calculated as the difference to reach 100%. |
|
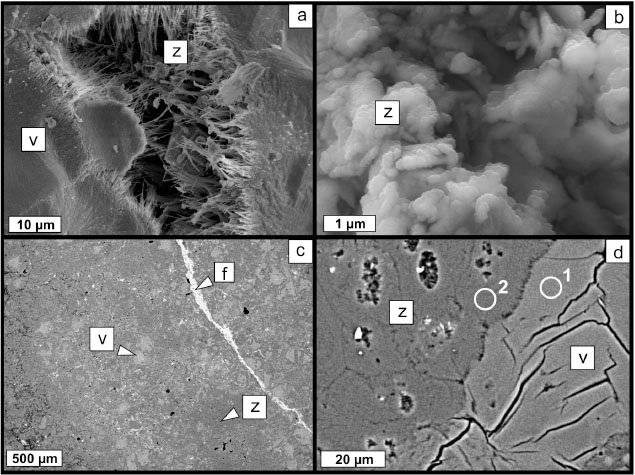 Figure 2. SEM of ZVB. a) Fibrous mordenite growing in a cavity over volcanic glass (SE - LEO EVO 40-XVP). b) Detail of vitreous sector being replaced by small and poorly formed zeolite crystals (SE - FE-Σigma). c) General texture of the mineralized zone (BSE - FE-Σigma). d) Detail of mordenite-volcanic glass interface (BSE - FE-Σigma). 1 and 2: Analyses listed in Table 2. (z: zeolite (mordenite); v: volcanic glass; f: K-feldspar). Figure 2. SEM of ZVB. a) Fibrous mordenite growing in a cavity over volcanic glass (SE - LEO EVO 40-XVP). b) Detail of vitreous sector being replaced by small and poorly formed zeolite crystals (SE - FE-Σigma). c) General texture of the mineralized zone (BSE - FE-Σigma). d) Detail of mordenite-volcanic glass interface (BSE - FE-Σigma). 1 and 2: Analyses listed in Table 2. (z: zeolite (mordenite); v: volcanic glass; f: K-feldspar).
|
|
XRD analysis (Figure 3) indicated that the main zeolite identified was mordenite (ICSD 00-029-1257) with main reflections at 9.06 Å, 4.0 Å and 3.48
Å. Additionally, plagioclase and K-feldspar were identified as accessory phases. A hump of the background was observed between
20 and 30° 2, indicating the presence of amorphous material (relict volcanic glass). In some samples, opal-CT (SiO2 phase) was also detected with minor amounts of clinoptilolite, beidellite-montmorillonite and Ti- or Fe-oxides, in agreement with other authors (38).
|
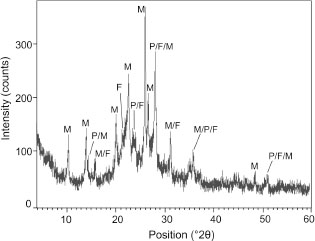 Figure 3. XRD pattern of ZVB (M: mordenite, F: K-feldspar, P: plagioclase). Figure 3. XRD pattern of ZVB (M: mordenite, F: K-feldspar, P: plagioclase).
|
|
The zeolite content in the ZVB is variable, with 25% on average and a standard deviation of 6.6%, although some sectors in the rock are almost totally zeolitized (~80%). More permeable sectors such as cavities and cracks show intense blue staining,
while the rest of the matrix is blue to light blue (Figure 4). The non-zeolitized vitreous clasts are not stained. The content of vitreous phase determined by this method assuming a small influence of other crystalline phases (K-feldspars, plagioclase, Opal-CT and oxides) ranges between 70% and 75%.
|
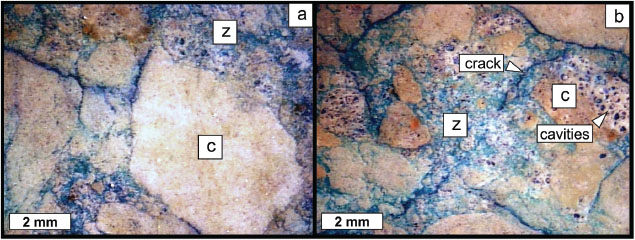 Figure 4. Photomicrographs of stained polished slab. a) Sector with predominance of non-zeolitized vitreous clasts. b) Sector with predominance of strongly zeolitized matrix. (c: vitreous clasts. z: highly zeolitized matrix). Figure 4. Photomicrographs of stained polished slab. a) Sector with predominance of non-zeolitized vitreous clasts. b) Sector with predominance of strongly zeolitized matrix. (c: vitreous clasts. z: highly zeolitized matrix).
|
|
3.2. Ground ZVB characterizationTOP
The physical characteristics of the ground ZVB are summarized in Table 3 and compared to those of OPC. The PSD curves for ZVB and OPC are presented in Figure 5, and their granulometric parameters are reported in Table 3. A grinding time of 120 min was necessary so that less than 12% ZVB was retained on 45 μm sieve. The PSD curve of ZVB has unimodal distribution with a high volume of particle size at 21.4 μm and two humps at 5.4 μm and 0.9 μm. Compared with OPC,
the PSD is thinner. The specific surface of ZVB determined by the Blaine method was larger than that of the OPC, and the density value was lower.
Table 3. Physical properties of the ground ZVB and OPC.
| Material |
Density (g/cm3) |
Specific surface (m2/kg) |
Retained on 45 μm sieve (%) |
PSD parameters (μm) |
| d90 |
d50 |
d10 |
| Ground ZVB |
2.14 |
798 |
4.80 |
33.53 |
2.61 |
1.23 |
| OPC |
3.13 |
354 |
2.85 |
60.74 |
18.72 |
2.74 |
|
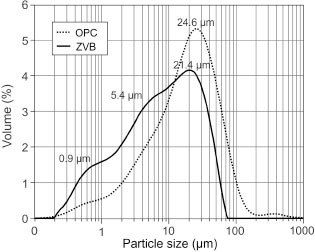 Figure 5. PSD curves of the ground ZVB and OPC. Figure 5. PSD curves of the ground ZVB and OPC.
|
|
Table 2 also reports the chemical composition of the ground ZVB. The sum of SiO2+Al2O3+Fe2O3 (80.1%) is greater than 70% and the SO3 is below the detection limit of the equipment, allowing the chemical requirements of ASTM C618 (39) for natural pozzolan Class N. However, the structural water content in this type of pozzolan causes a LOI greater than 10%
as required by the standard.
The TGA curve (Figure 6 - solid line) of the ground ZVB shows a continuous mass loss during heating, attaining a total mass loss of 11.93%. Between
20 and 110 °C, the mass loss is assigned to desorption of free water into the zeolite structure (hygroscopic water), while the mass loss in the 110–230 °C range is attributed to desorption of very loosely held water (40,41). A broad endothermic peak is recognized in the DSC curve (heat flow) in the 20–230 °C range due to these two processes (42). The mass loss above 230 °C could be due to strongly bound water (43) or the dehydroxylation of zeolite (44). According to Pechar and Rykl (43), mordenite is stable up to 510 °C without significant changes in its structure.
|
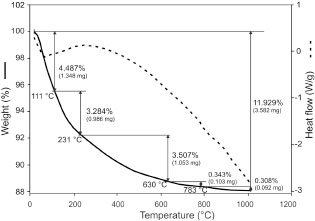 Figure 6. DSC (dashed line) and TGA (solid line) curves of the ground ZVB. Figure 6. DSC (dashed line) and TGA (solid line) curves of the ground ZVB.
|
|
Figure 7 shows the FT-IR spectrum of the ground ZVB. The main bands were assigned according to Jansen et al. (45), Deshpande & Bhoskar (46) and Ostroumov & Corona-Chávez (47). The 3620 and 3454 cm−1 bands are well defined and are assigned to the OH-stretching vibration, while the 1643 cm−1 band is due to H-O-H bending of water. The vibration of T-O bending is assigned to 1223 and 791 cm−1 (external asymmetric and symmetric stretching, respectively), 1051 and 727 cm−1 (internal asymmetric and symmetric stretching, respectively), and 469 cm−1 bands (possibly bending). The bands at 627, 577 and 523 cm−1 could be attributed to double-ring tetrahedral vibrations. Minor peaks observed at 2879, 2232 and 1440 cm−1 could not be assigned.
Table 4 gives the results of CEC and exchangeable cations of the ground ZVB (average of two determinations). According to Mumpton
(48), the CEC of mordenite is 2.29 meq/g (calculated from unit-cell formula). Therefore, considering the CEC determined, ~25.8%
of mordenite in ZVB can be estimated, which is similar to the percentage determined by the staining technique.
Table 4. CEC and exchangeable cations of ground ZVB (meq/100g).
| Material |
CEC |
Exchangeable cations |
| K |
Ca |
Mg |
Na |
| Ground ZVB |
59.2 |
11.1 |
13.95 |
0.76 |
17.96 |
3.3. Performance of ground ZVB as SCMTOP
3.3.1. Minislump testTOP
Figure 8 shows the flow spread diameter (cm) as a function of time (min) for OPC and OPC+ZVB pastes. For OPC paste, the initial spread diameter (10.2 cm) was higher than that corresponding to OPC+ZVB (7.8 cm), confirming water consumption due to zeolite-rich addition. The minislump of OPC+ZVB remains for 30 min, and thereafter its loss rate is higher than that corresponding to the OPC paste.
|
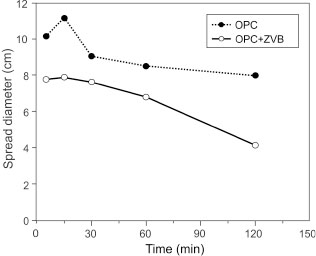 Figure 8. Results of minislump test of OPC and OPC+ZVB pastes. Figure 8. Results of minislump test of OPC and OPC+ZVB pastes.
|
|
3.3.2. Heat releasedTOP
Figure 9 shows the evolution of the heat release rate (mW/g) and cumulative heat release (J/g) as a function of time (min) for OPC and OPC+ZVB. The heat release rate curve is characterized by: a) the initial signal due to dissolution, wetting and initial hydration; b) the dormant period; c) the second peak corresponding to the C3S hydration characterized by the slope, the maximum heat release rate and the occurrence time; d) the third peak associated with C3A hydration due to sulfate depletion characterized by its intensity and the occurrence time.
|
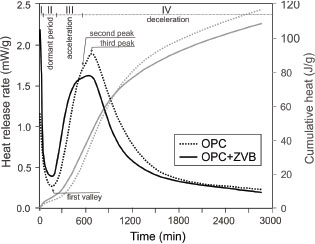 Figure 9. Heat release rate and cumulative heat released curves of OPC and OPC+ZVB. Figure 9. Heat release rate and cumulative heat released curves of OPC and OPC+ZVB.
|
|
The initial heat release rate is very high when water is mixed with cementitious materials. Then, the signal decreases to the first valley at 180 min with a rate of 0.27 mW/g for OPC and it occurs 15 min before with a high rate (0.40 mW/g) for OPC+ZVB. For OPC, C3S hydration starts with a sudden heat-rate acceleration (0.00513 mW/g.min) reaching the second peak at 570 min with a rate of 1.72 mW/g. For cement with ZVB, it starts with a similar acceleration rate (0.00516 mW/g.min) but the maximum occurs 60
min before (510 min) with a low heat rate (1.57 mW/g). The sulfate depletion point appears approximately at 610 and 560 min for OPC and OPC+ZVB, respectively. However, it is poorly marked in the curves due to the low C3A-content of OPC used. The third peak occurs at 670 min with a rate of 1.87 mW/g for OPC and at 630 min with a rate of 1.62
mW/g for OPC+ZVB. The cumulative heat release (Figure 9) shows that the OPC+ZVB has a great value up to ~16 h and then it is lower than that corresponding to OPC.
3.3.3. Frattini testTOP
Results of the Frattini test are reported in Figure 10. For OPC, the points representing [CaO] and [OH−] are above the calcium solubility isotherm, indicating that the solution is saturated in portlandite, except at 90 days when the [CaO] decrease is attributed to the CO2 dissolved in the supernatant solution. For OPC+ZVB, the points at 2 and 7 days are above the calcium solubility isotherm,
revealing no pozzolanic activity. After 28 days, the points fall below the isotherm, indicating that the pozzolanic material reacts with dissolved Ca(OH)2 at a high rate giving an unsaturated supernatant solution. The [CaO] is higher than that corresponding to OPC at 2 days and it is similar at 7 days, while the [OH−] increases slightly. At 28 and 90 days, the [CaO] is lower than that of OPC, and the [OH−] increases significantly at later ages. This test determines that ZVB has good pozzolanic activity and is classified as slow reactive pozzolanic material.
|
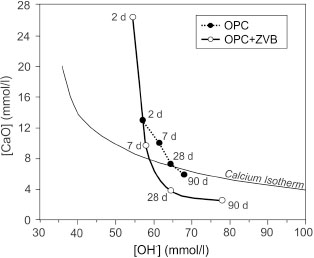 Figure 10. Results of the Frattini test of OPC and OPC+ZVB. Figure 10. Results of the Frattini test of OPC and OPC+ZVB.
|
|
3.3.4. Compressive strength and SAITOP
The mortars used to determine the compressive strength and SAI have a flow of 125% (OPC) and 91% (OPC+ZVB). As reported for the minislump, the addition of the zeolitic material reduces the workability of mortar. Figure 11 shows the compressive strength and SAI values for mortars up to 90 days. At early ages (2 and 7 days), the compressive strength of OPC+ZVB (13.3 MPa and 26.3 MPa) is lower than that of the OPC mortar (18.6 MPa and 34.8 MPa). However, the compressive strength at 28 and 90 days (47.3 and 58.2 MPa) is greater than the compressive strength of OPC (46.6 and 53.7 MPa). The SAI at 28 and 90 days is 1.02 and 1.08, exceeding the values required by the EN 450-1 standard (34).
|
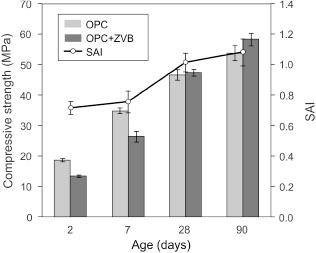 Figure 11. Compressive strength and SAI values for OPC and OPC+ZVB mortars. Figure 11. Compressive strength and SAI values for OPC and OPC+ZVB mortars.
|
|
3.3.5. HydrationTOP
The textural-chemical characteristics of OPC+ZVB mortar after 90 days of hydration are depicted in Figure 12. The BSE image (Figure 12a) shows the main phases identified according to elemental maps of Si, Ca, Al, K, Na, Fe, Mg and S (Figure 12b-i). Sand aggregates (A) are identified by a high Si content (Figure 12b) and the complete absence of Ca, Al, K and Na (Figure 12c-f). The ZVB grains are characterized by high Si and Al (Figure 12d), low Ca (almost zero compared to the cement paste) and abundant content of alkalis (Na and K in Figure 12e and 12f, respectively). The cement matrix is dominated by high Ca content and pores appear as black holes in the BSE image. C4AF is identified by its light gray color in BSE image (1) and characterized by the superimposition of Ca, Al and Fe (Figure 12e) elemental maps. C4AF hydrates are recognized at the grain boundaries (Figure 12g). CH crystals grow into the pores and also occupy the paste-aggregate interface zone (3). They are characterized by Ca-rich sectors and the absence of other elements. C-S-H, AFm and AFt phases in the paste also grow as intergrowth submicron phases that could not be distinguished using this technique.
|
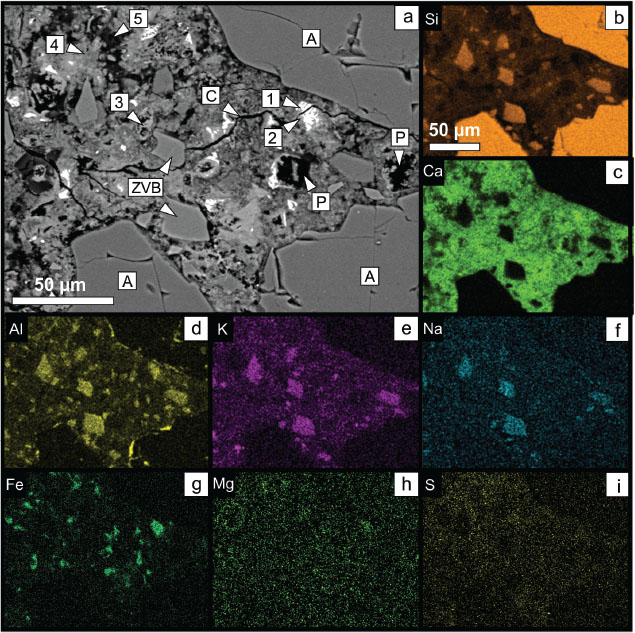 Figure 12. SEM-EDS. a) BSE image of OPC+ZVB mortar after 90 days of hydration. b-i) Compositional maps of Si (b), Ca (c), Al (d), K (e), Na (f), Fe (g), Mg (h) and S (i) of the same sector. (A: siliceous aggregate, C: crack, P: pore, ZVB: zeolitized vitreous breccia, 1: C4AF, 2: hydrated C4AF, 3: Ca(OH)2, 4: Ca(±Al)-rich C-S-H, 5: Si-rich C-S-H). Figure 12. SEM-EDS. a) BSE image of OPC+ZVB mortar after 90 days of hydration. b-i) Compositional maps of Si (b), Ca (c), Al (d), K (e), Na (f), Fe (g), Mg (h) and S (i) of the same sector. (A: siliceous aggregate, C: crack, P: pore, ZVB: zeolitized vitreous breccia, 1: C4AF, 2: hydrated C4AF, 3: Ca(OH)2, 4: Ca(±Al)-rich C-S-H, 5: Si-rich C-S-H).
|
|
Figure 13 (BSE image) shows a detail of the cement paste rich in ZVB and elemental profiles of Si, Ca, Al, K and Na crosscutting the grains. The image shows a rim of Si-rich compound on the surface of the ZVB grains with minor amounts of Ca, Al, Na and K.
The composition of ZVB grains varies from the center to the boundary, decreasing their concentration in Si, Al, K and Na (less evident) and increasing the Ca content. The composition of these compounds at the boundary is related to the C-S-H and C-A-S-H phases, indicating the deposition of pozzolanic reaction products at the ITZ.
|
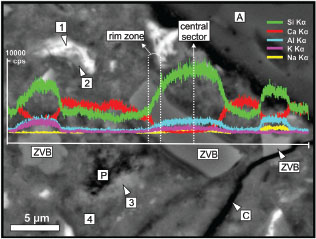 Figure 13. SEM-EDS. BSE image of a sector rich in ZVB particles and elemental profiles of Si, Ca, Al, K and Na. (A: siliceous aggregate, C: crack, P: pore, ZVB: zeolitized vitreous breccia, 1: C4AF, 2: hydrated C4AF, 3: Ca(OH)2, 4: Ca(±Al)-rich C-S-H). Figure 13. SEM-EDS. BSE image of a sector rich in ZVB particles and elemental profiles of Si, Ca, Al, K and Na. (A: siliceous aggregate, C: crack, P: pore, ZVB: zeolitized vitreous breccia, 1: C4AF, 2: hydrated C4AF, 3: Ca(OH)2, 4: Ca(±Al)-rich C-S-H).
|
|
Figure 14 shows the evolution of non-evaporable water (Wn) for OPC and OPC+ZVB pastes. In this figure, the dashed line represents the curve corresponding to 75% Wn of plain cement. During the test, cement hydration with the zeolitic material produces a smaller Wn amount than the OPC paste. Up to 28 days, the Wn was lower than the proportion equivalent to 75% of OPC, but it exceeded that value after 28 days. This behavior can be interpreted as a slow contribution to the Wn caused by the pozzolanic reaction.
|
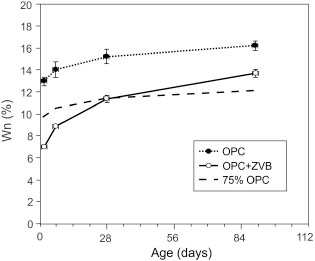 Figure 14. Evolution of the non-evaporable water (Wn) in OPC and OPC+ZVB pastes. Dashed line: 75% Wn of plain cement. Figure 14. Evolution of the non-evaporable water (Wn) in OPC and OPC+ZVB pastes. Dashed line: 75% Wn of plain cement.
|
|
The XRD patterns for hydrated pastes from 2 to 90 days are presented in Figure 15. For OPC (Figure 15a), at 2 days the Ca(OH)2 (d = 4.88 Å; 2.63 Å) and ettringite (d = 9.62 Å) appear as hydration products coexisting with the main anhydrous phases of portland clinker (C3S, C2S and C4AF) as and calcite incorporated as minor constituent. After 7 days, the formation of AFm phase appears (hemicarboaluminate,
d = 8.17 Å) while ettringite and Ca(OH)2 peaks grow. The anhydrous clinker phases decrease. After 28 days, the AFm phase is transformed into monocarboaluminate (d
= 7.55 Å), which is predominant at 90 days together with high intensity CH peaks. For OPC+ZVB paste (Figure 15b), the AFt and AFm phases are absent in the XRD patterns. From 2 to 7 days, the intensity of the Ca(OH)2 peaks increases, it is maintained at 28 days and then it decreases at 90 days, indicating that the pozzolanic reaction progresses.
A large proportion of the silicate phases of the cement appear hydrated at 7 days and then fade. The mordenite peaks (d =
3.97 Å, 3.46 Å, 3.20 Å) are defined in the XRD patterns at 2 and 7 days, but later they become wider and their intensity decays.
However, mordenite peaks are clearly assignable at 90 days.
|
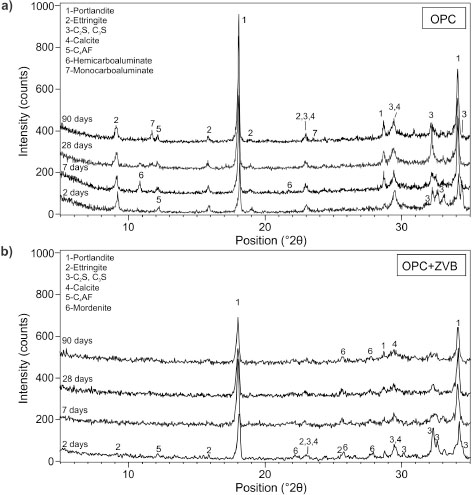 Figure 15. XRD of hydrated paste at 2, 7, 28 and 90 days; a) OPC, b) OPC+ZVB. Figure 15. XRD of hydrated paste at 2, 7, 28 and 90 days; a) OPC, b) OPC+ZVB.
|
|
4. DISCUSSIONTOP
The ZVB is mainly composed of abundant clasts of perlitic and spherulitic glass of rhyolitic composition, and mordenite zeolite,
with crystals of very fine grain size (< 100 nm) and fibrous crystals (~50 μm long), with radial growth predominating. The volume and density of the mineralized sectors are variable, forming banks of several meters in thickness, with intercalations of vitreous levels (non-brecciated). The irregularity of the alteration would be linked to the difference in permeability between both sectors.
According to the staining technique implemented, the zeolite content in the studied sample is ~25%, in agreement with the estimation made through CEC determined by NH4+ exchange in the ground ZVB. The main cations exchanged were Na>Ca>K>Mg.
FT-IR results indicate the presence of free water in the sample. The mass loss in TGA (11.9% - Figure 6) is nearly coincident with water calculated (difference to reach 100%) in mordenite by SEM-EDS (~11.8% - Table 2), but the mordenite only occupies a quarter of the bulk sample. SEM-EDS analysis shows that volcanic glass also has a high water content (~10.8% - Table 2). It is higher than in typical non-altered glasses (~5%) (49), therefore, it could be partially transformed into zeolite and contributes to the final mass loss measured. However, since both volcanic glass and mordenite contribute to the mass loss during heating, it is difficult to discriminate one from the other in the TGA curve. Although the standard specifies a limit of 10% for LOI (39), it can be seen that the mass loss between 20 and 110 °C in the TG curve (Figure 6) due to hygroscopic water is ~4.5%. The mass loss above ~110 °C is assignable to water held in the zeolite structure and should not be taken into account in the specification indicated by the standard.
The addition of zeolite-bearing pozzolan to portland cement causes several effects: the hydration of the cement occurred much earlier (12, 15, 50, 51, 52, 53), the high exchange capacity of pore solution ions influenced the formation of C-S-H and the later pozzolanic activity. The reactivity depends on the type and characteristics of zeolite, and the mordenite type zeolite appears as slow reactive (12, 17).
The large specific surface and porous structure of zeolite can decrease the free water content in the paste, reducing the initial paste minislump or mortar flow and causing the minislump loss (Figure 8). Results of the heat release (Figure 9) and the Frattini test (Figure 10) reveal that the addition of ZVB to OPC stimulates the hydration of the portland cement fraction at early ages. Early stimulation could be attributed to changes in the concentration of ionic species in the pore solution caused by the CEC and the increase of nucleation sites. Furthermore, the replacement by weight of ZVB with lower density than the OPC increases the volume of solids in the paste decreasing the interparticle distance (54, 55). The stimulation is controlled by the exchangeable cation (predominantly Na in this case) with Ca and (OH)− (53) that reduces the ionic strength in the pore solution, causing a quick dissolution and hydration of portland cement (the calorimetric curve moves to the left) and the second and the third peaks appear at early ages. However, the lower intensity of both peaks reveals the dilution effect caused by the ZVB replacement. In the Frattini test (Figure 10), the stimulation effect increases the Ca(HO)2 released by C3S hydration at early age, and the [CaO] increases in the supernatant solution. For the 25% replacement, the stimulation effect cannot compensate the dilution effect, and the compressive strength (Figure 11) and Wn (Figure 14) are much lower than that obtained in the OPC. Low Wn can also be attributed to the absence of AFt and AFm phases in the compound assemblage (Figure 15b) with larger proportion of combined water in their structure.
At later ages, the ZVB shows pozzolanic activity, as revealed by the Frattini test. The pozzolanic reaction involves the consumption of Ca(OH)2, and [CaO] decreases in the Frattini diagram up to 90 days. On the other hand, [OH−] increases indicating that hydroxyl ions are released from rhyolitic glass or zeolite. This pozzolanic reaction contributes to mortar strength, attaining a value similar to that corresponding to OPC. The non-evaporable water increases, but some part of Ca(OH)2 remains in the paste, as revealed by the XRD pattern (Figure 15b) and BSE-SEM analysis (Figure 12).
In the ZVB, aluminum is mainly present in glass and mordenite (~11%-12% Al2O3). In recent experiences (56) it was observed that ZVB is transformed almost completely into Na-P zeolite when it is maintained in a 1 N NaOH solution for 6 weeks (at 40 °C) or in a mixture of Na-P zeolite and analcime for 4 weeks (at 95 °C). According to Blanc et al. (57), mordenite is not stable in the high pH conditions of the concrete. In this scenario and assuming a system saturated with respect to calcium, it is expected that Al-rich zeolites or Al-containing cement phases will stabilize. In the case of ZVB,
~70%-75% of the material corresponds to rhyolitic volcanic glass, of known instability in alkaline conditions (55). Therefore, it is possible that pozzolan (mainly glass particles and possibly mordenite) react to form more stable C-S-H and/or Al-containing phases, mainly at the periphery of the particles (Figure 13).
However, mordenite peaks in the XRD pattern (Figure 15b) remain at 90 days, indicating that the pozzolanic activity could mainly be attributed to the glass phases included in the ZVB. This behavior was also corroborated by SEM–EDS results (Figure 12). It is observed that the pozzolan grains remain in the bulk mass of mortar with a high content of Si, Al and K, and the pozzolanic reaction products form a rim around the grain, possibly due to the vitreous content in the breccia (Figure 13). In addition, alkalis could also be released by dissolution of rhyolitic glass, increasing [OH−] in the Frattini test at 90 days. Transformation of mordenite into more stable phases is not discarded, due to its chemical instability in high alkaline solutions, but more studies are needed in order to completely understand its role in volcanic pozzolan performance.
Summarizing, the addition of ZVB to cement causes two main effects. At early ages, the water demand increases due to the high specific surface and the high CEC of ZVB, reducing the minislump and the mortar flow. On the other hand, the cement hydration reactions are stimulated, but the high hydration degree of OPC fraction cannot compensate the dilution effect caused by 25%
of replacement. Later, the pozzolanic reaction increases the combined water and the relative compressive strength (SAI >
1.00) of the blended cement. The pozzolanic reaction is mainly attributed to the glass reaction, and to a lesser extent to the mordenite-type zeolite. XRD and SEM-EDS studies reveal that mordenite and Ca(OH)2 remains in the paste and mortar after 90 days.
5. CONCLUSIONSTOP
This vitreous breccia contains some sectors rich in volcanic glass and others partially to completely altered to mordenite.
This irregular mineralization of the rock requires a comprehensive evaluation of the material to estimate its potential use as a pozzolan. Textural and mineralogical characterization by optical microscopy, XRD and SEM-EDS is highly recommended. The proportion of mordenite and glass in the bulk sample estimated with the methylene blue staining technique and imaging processing is ~25%, comparable with the estimation made through CEC determined on the homogenized ground ZVB.
Textural and mineralogical analyses show that ZVB is heterogeneous, with vitreous areas slightly zeolitized and other sectors strongly altered to zeolite. The most distributed phase replacing the vitreous material is fine-grained mordenite with no obvious habit, while the fibrous variety of this mineral and prismatic clinoptilolite are less abundant. K-feldspar, plagioclase,
opal-CT, Ti- or Fe-oxides/hydroxides and clay minerals were identified as accessory phases (< 1%).
The ZVB does not meet the LOI limit of ASTM C618 standard. Results of DSC-TGA and FT-IR complemented by bulk (ICP) and chemical analyses (SEM-EDS) of each phase confirm that zeolite and glass have similar chemical composition with ~11.5% of water. However,
only ~4.5% is lost up to ~110 °C, assignable to hygroscopic water, and the rest (above 110 °C) is assignable to water held in the zeolite structure.
Two main effects were observed when ZVB was used as SCM. First, the water demand increases at early ages, reducing the minislump and the mortar flow. Second, the pozzolanic reaction increases the combined water and the relative compressive strength (SAI
> 1.00) of the blended cement.
The pozzolanic reaction can mainly be attributed to the high reactivity of volcanic glass in alkaline conditions, while the zeolitization of volcanic glass contributes to increasing the exposed surface and ion transport for the pozzolanic reaction.
ACKNOWLEDGEMENTSTOP
Financial support was provided by PICT 2015 Nº 367 (FONCyT). Authors thank (UN del Centro de la Provincia de Buenos Aires, Comisión de Investigaciones Científicas de la Provincia de Buenos Aires- CONICET); CICTERRA (CONICET-UN Córdoba); Departamento de Geología - UNl del Sur and Centro de Geología Aplicada, Agua y Medio Ambiente (CGAMA-CIC-UNS).
REFERENCESTOP
| 1. |
Scrivener, K.L.; John, V.M.; Gartner, E.M. (2017) Eco-efficient cements: Potential economically viable solutions for low-CO2 cement-based materials industry, Revised Edition, United Nations Environment Programme, Paris, France. |
| 2. |
Damtoft, J.S.; Lukasik, J.; Herfort, D.; Sorrentino, D.; Gartner, E.M. (2008) Sustainable development and climate change initiatives. Cem. Concr. Res. 38[2], 115–127. https://doi.org/10.1016/j.cemconres.2007.09.008 |
| 3. |
Valipour, M.; Yekkalar, M.; Shekarchi, M.; Panahi, S. (2014) Environmental assessment of green concrete containing natural zeolite on the global warming index in marine environments. J. Clean Prod. 65, 418–423. https://doi.org/10.1016/j.jclepro.2013.07.055 |
| 4. |
ACI Committee 232 (2012) Report on the use of raw or processed natural pozzolans in concrete, ACI 232.1R, American Concrete Institute, Farmington Hills, USA. |
| 5. |
Massazza, F. (1998) Pozzolana and pozzolanic cements, In: Hewlett, P.C. (Ed.), Lea’s Chemistry of Cement and Concrete, Elsevier, Amsterdam, pp. 471–635. |
| 6. |
Passaglia, E.; Sheppard, R.A. (2001) The crystal chemistry of zeolites. In: Bish, D.L.; Ming, D.W. (Eds.), Natural zeolites: occurrences, properties, applications. Reviews in Mineralogy and Geochemistry 45, Mineralogical Society of America, Chantilly, USA, pp. 69–116. https://doi.org/10.1515/9781501509117-004 |
| 7. |
Coombs, D.S.; Alberti, A.; Armbruster, T.; Artioli, G.; Colella, C.; Galli, E.; Grice, J.D.; Liebau, F.; Mandarino, J.A.;
Minato, H.; Nickel, E.H.; Passaglia, E.; Peacor, D.R.; Quartieri, S.; Rinaldi, R.; Ross, M.; Sheppard, R.A.; Tillmanns, E.;
Vezzalini, G. (1998) Recommended nomenclature for zeolite minerals: report of the subcommittee on zeolites of the International Mineralogical Association, Commission on New Minerals and Mineral Names, Miner. Mag. 62[4], 533–571. https://doi.org/10.1180/002646198547800 |
| 8. |
Bish, D.L.; Carey, J.W. (2001) Thermal behavior of natural zeolites. In: Bish, D.L.; Ming, D.W. (Eds.), Natural zeolites: occurrences, properties, applications. Reviews in Mineralogy and Geochemistry 45, Mineralogical Society of America, Chantilly, USA, pp. 403–452. https://doi.org/10.1515/9781501509117-015 |
| 9. |
Auerbach, S.M.; Carrado, K.A.; Dutta, P.K. (2003) Handbook of zeolite science and technology, Marcel Dekker, Inc., New York, 2003. |
| 10. |
Colella, A.; Di Benedetto, C.; Calcaterra, D.; Cappelletti, P.; D’Amore, M.; Di Martire, D.; Graziano, S.F.; Papa, L.;
de Gennaro, M.; Langella, A. (2017) The Neapolitan Yellow Tuff: An outstanding example of heterogeneity. Constr. Build. Mater. 136[1], 361–373. https://doi.org/10.1016/j.conbuildmat.2017.01.053 |
| 11. |
Fragoulis, D.; Chaniotakis, E.; Stamatakis, M.G. (1997) Zeolitic tuffs of Kimolos Island, Aegean Sea, Greece and their industrial potential. Cement Concrete Res. 27[6], 889–905. https://doi.org/10.1016/S0008-8846(97)00072-0 |
| 12. |
Mertens, G.; Snellings, R.; Van Balen, K.; Bicer-Simsir, B.; Verlooy, P.; Elsen, J. (2009) Pozzolanic reactions of common natural zeolites with lime and parameters affecting their reactivity. Cem. Concr. Res. 39[3], 233–240. https://doi.org/10.1016/j.cemconres.2008.11.008 |
| 13. |
Vigil de la Villa, R.; Fernández, R.; García, R.; Villar-Cociña, E.; Frías, M. (2009) Pozzolanic activity and alkaline reactivity of a mordenite-rich tuff. Micropor. Mesopor. Mat. 126[1–2], 125–132. https://doi.org/10.1016/j.micromeso.2009.05.029 |
| 14. |
Janotka, I.; Mojumdar; S.C. (2003) Hydration of portland cement, natural zeolite mortar in water and sulphate solution.
Mater. Construcc. 53[269], 17–27. https://doi.org/10.3989/mc.2003.v53.i269.265 |
| 15. |
Snellings, R.; Mertens, G.; Cizer, Ö.; Elsen, J. (2010) Early age hydration and pozzolanic reaction in natural zeolite blended cements: Reaction kinetics and products by in situ synchrotron X-ray powder diffraction. Cem. Concr. Res. 40[12], 1704–1713. https://doi.org/10.1016/j.cemconres.2010.08.012 |
| 16. |
Cornejo, M.H.; Elsen, J.; Paredes, C.; Baykara, H. (2015) Hydration and strength evolution of air-cured zeolite-rich tuffs and siltstone blended cement pastes at low water-to-binder ratio. Clay Min. 50[1], 133–152. https://doi.org/10.1180/claymin.2015.050.1.12 |
| 17. |
Özen, S.; Göncüoˇlu, M.C.; Liguori, B.; de Gennaro, B.; Cappelletti, P.; Gatta, G.D.; Iucolano, F.; Colella, C. (2016)
A comprehensive evaluation of sedimentary zeolites from Turkey as pozzolanic addition of cement- and lime-based binders. Constr. Build. Mater. 105, 46–61. https://doi.org/10.1016/j.conbuildmat.2015.12.055 |
| 18. |
Chen, J.J.; Li, L.G.; Ng, P.L.; Kwan, A.K.H. (2017) Effects of superfine zeolite on strength, flowability and cohesiveness of cementitious paste. Cem. Concr. Comp. 83, 101–110. https://doi.org/10.1016/j.cemconcomp.2017.06.010 |
| 19. |
Snellings, R.; Mertens, G.; Gasharova, B.; Garbev, K.; Elsen, J. (2010) The pozzolanic reaction between clinoptilolite and portlandite: a time and spatially resolved IR study. Eur. J. Mineral. 22[6], 767–777. https://doi.org/10.1127/0935-1221/2010/0022-2019 |
| 20. |
Poon, C.S.; Lam, L.; Kou, S.C.; Lin, Z.S. (1999) A study on the hydration rate of natural zeolite blended cement pastes.
Constr. Build. Mater. 13[8], 427–432. https://doi.org/10.1016/S0950-0618(99)00048-3 |
| 21. |
Najimi, M.; Sobhani, J.; Ahmadi, B.; Shekarchi, M. (2012) An experimental study on durability properties of concrete containing zeolite as a highly reactive natural pozzolan. Constr. Build. Mater. 35, 1023–1033. https://doi.org/10.1016/j.conbuildmat.2012.04.038 |
| 22. |
Gargiulo, M.; Crosta, S.; Leal, P.; Vattuone, M. (2017) Las zeolitas naturales de Argentina. In: Costafedra Mustelier,
J.L.; Sánchez, D.A.M.; Costafedra Velázquez, J.L. (Eds.), Las zeolitas naturales de Iberoamérica, Fundación Gómez Pardo, Madrid, 58–136. |
| 23. |
Raggiotti, B.B.; Positieri, M.J.; Locati, F.; Murra, J.; Marfil, S. (2015) Zeolite, study of aptitude as a natural pozzolan applied to structural concrete, Rev. Construcc. 14[2], 14–20. https://doi.org/10.4067/S0718-915X2015000200002 |
| 24. |
Locati, F.; Falcone, D.; Marfil, S.; Raggiotti, B. (2015) Use of natural zeolites as ASR inhibitor in basaltic rocks. In:
Villagrán-Zaccardi, Y.; Zega, C.; Torrijos, M.C. (Eds.), International Conference on Sustainable Structural Concrete (Sustain Concrete 2015), RILEM-LEMIT, La Plata, Argentina,. 381–392. |
| 25. |
Rasband, W.S. (2018) ImageJ, U.S. National Institute of Health, Bethesda, Maryland, USA, https://imagej.nih.gov/ij/ |
| 26. |
ASTM C430 (2017) Standard test method for fineness of hydraulic cement by the 45-μm (No. 325) sieve, ASTM International,
West Conshohocken, PA, USA. |
| 27. |
ASTM C188 (2017) Standard test method for density of hydraulic cement, ASTM International, West Conshohocken, PA, USA. |
| 28. |
ASTM C204 (2018), Standard test methods for fineness of hydraulic Cement by air-permeability apparatus, ASTM International,
West Conshohocken, PA, USA. |
| 29. |
EPA (2007) Method 3051A.U.S. EPA Method 3051A (SW-846): Microwave Assisted Acid Digestion of Sediments, Sludges, and Oils,
Revision 1, United States Environmental Protection Agency, Washington, DC, USA. |
| 30. |
EPA (1994) Method 200.7, Method 200.7: Determination of Metals and Trace Elements in Water and Wastes by Inductively Coupled Plasma-Atomic Emission Spectrometry, Revision 4.4, United States Environmental Protection Agency, Cincinnati, OH, USA. |
| 31. |
IRAM 1654 (2015) Puzolanas y Cenizas volantes silíceas. Parte 1: Métodos de ensayos físicos (Pozzolans and siliceous fly ash. Part 1: Physical test methods), IRAM, Buenos Aires, Argentina. |
| 32. |
Kantro, D. (1980) Influence of water-reducing admixtures on properties of cement paste—a miniature slump test. Cem. Concr. Aggr. 2[2], 95–102. https://doi.org/10.1520/CCA10190J |
| 33. |
EN 196-5 (2011) Methods of testing cement. Part 5: Pozzolanicity test for pozzolanic cement, British Standard Institution,
London, UK. |
| 34. |
EN 450-1 (2012) Fly ash for concrete. Part 1: Definition, specification and conformity criteria, British Standard Institution,
London, UK. |
| 35. |
EN 196-1 (2016) Methods of testing cement. Part 1: Determination of strength, British Standard Institution, London, UK. |
| 36. |
ASTM C1437 (2015) Standard Test Method for Flow of Hydraulic Cement Mortar, ASTM International, West Conshohocken, PA,
USA. |
| 37. |
Powers, T.C. (1949) The non-evaporable water content of hardened portland-cement paste. Its significance for concrete research and its method of determination, ASTM Bulletin.158, 68–76. |
| 38. |
Bengochea, L.; Mas, G.; Maiza, P.; Bengochea, J. (1997) Mordenite occurrence in the Mendoza Province, Argentina. In: Zeolite ´97. 5th International Conference on the occurrence, properties and utilization of natural zeolites, Ischia, Italy, 63–64. |
| 39. |
ASTM C 618 (2017) Standard specification for coal fly ash and raw or calcined natural pozzolan for use in concrete, ASTM International, West Conshohocken, PA, USA. |
| 40. |
Van Reeuwijk, L.P. (1974) The thermal dehydration of natural zeolites, Mededelingen Landbouwhogeschool Wageningen, 74–79. H. Veenman & Zonen B.V., Wageningen, Netherlands. |
| 41. |
Adriano, A.; Soriano, G.; Duque, J. (2013) Characterization of water absorption and desorption properties of natural zeolites in Ecuador. In: Fifth International Symposium on Energy, Puerto Rico Energy Center-Laccei, Puerto Rico, 1–9. |
| 42. |
Zvereva, I.; Kremnev, R.; Sirotov, V.; Rodríguez-Iznaga, I.; Hernández, M.A.; Petranovskii, V. (2017) Thermal analysis and porosimetry of natural zeolites from Mexican and Cuban deposits. App. Solid State Chem. 1, 35–41. https://doi.org/10.18572/2619-0141-2017-1-1-35-41 |
| 43. |
Pechar, F. Rykl, D. (1987) Thermal decomposition of natural mordenite, Chem. Pap. 41[3], 351–362. https://www.chempap.org/?id=7&aper=4287 |
| 44. |
Földvári, M. (2011) Handbook of thermogravimetric system of minerals and its use in geological practice. Occasional Papers of the Geological Institute of Hungary 213, Geological Institute of Hungary, Budapest, Hungary. |
| 45. |
Jansen, J.C.; van der Gaag, F.J.; van Bekkum, H. (1984) Identification of ZSM-type and other 5-ring containing zeolites by IR spectroscopy. Zeolites, 4[4], 369–372. https://doi.org/10.1016/0144-2449(84)90013-7 |
| 46. |
Deshpande, V.P.; Bhoskar, B.T. (2012) Ion exchange and dielectric study of mordenite, International Journal of Engineering Research & Technology, 1[8], 1–22. |
| 47. |
Ostroumov, M.; Corona-Chávez, P.(2003) Mineralogical study of mordenite from the Sierra Madre del Sur, southwestern Mexico.
Rev. Mex. Cienc. Geol. 20[2], 133–138. |
| 48. |
Mumpton, F.A. (1999) La roca mágica: Uses of natural zeolites in agriculture and industry. Proceedings of the National Academy of Sciences of the Unites States of America. 96[7], 3463–3470. https://doi.org/10.1073/pnas.96.7.3463 |
| 49. |
Tazaki, K.; Tiba, T.; Aratani, M.; Miyachi, M. (1992) Structural water in volcanic glass, Clay Clay Min. 40[1], 122–127. https://doi.org/10.1346/CCMN.1992.0400113 |
| 50. |
Martínez-Ramírez, S.; Blanco-Varela, M.T.; Ereña, I.; Gener, M. (2006) Pozzolanic reactivity of zeolitic rocks from two different Cuban deposits: Characterization of reaction products. Appl. Clay Sci. 32[1–2], 40–52. https://doi.org/10.1016/j.clay.2005.12.001 |
| 51. |
Caputo, D.; Liguori, B.; Colella, C. (2008) Some advances in understanding the pozzolanic activity of zeolites: The effect of zeolite structure. Cem. Concr. Comp. 30[5], 455–462. https://doi.org/10.1016/j.cemconcomp.2007.08.004 |
| 52. |
Tydlitát, V.; Zákoutský, J.; ˇerný, R. (2014) Early-stage hydration heat development in blended cements containing natural zeolite studied by isothermal calorimetry. Thermochimica Acta. 582, 53–58. https://doi.org/10.1016/j.tca.2014.03.003 |
| 53. |
Rahhal, V.F.; Pavlík, Z.; Tironi, A.; Castellano, C.C.; Trezza, M.A.; ˇerný, R.; Irassar, E.F. (2017) Effect of cement composition on the early hydration of blended cements with natural zeolite. J Therm Anal Calorim. 128[2], 721–733. https://doi.org/10.1007/s10973-016-6007-4 |
| 54. |
Bentz, D.P.; Ferraris, C.F.; Galler, M.A.; Hansen, A.S.; Guynn, J.M. (2012) Influence of particle size distributions on yield stress and viscosity of cement-fly ash pastes. Cem. Concr. Res. 42[2], 404–409. https://doi.org/10.1016/j.cemconres.2011.11.006 |
| 55. |
Guo, Y.; Zhang, T.; Wei, J.; Yu, Q.; Ouyang, S. (2017) Evaluating the distance between particles in fresh cement paste based on the yield stress and particle size. Constr. Build. Mater. 142, 109–116. https://doi.org/10.1016/j.conbuildmat.2017.03.055 |
| 56. |
Locati, F.; Marfil, S.; Lescano, L.; Madsen, L.; Cravero, F.; Castillo, L.; Barbosa, S.; Maiza. P. (2017) Síntesis de zeolita Na-P en solución alcalina a partir de una toba vítrea parcialmente zeolitizada. Revista de Geología Aplicada a la Ingeniería y al Ambiente, 39, 1–7. https://www.editoresasagai.org.ar/ojs/index.php/rgaia/article/view/140 |
| 57. |
Blanc, P.; Vieillard, P.; Gailhanou, H.; Gaboreau, S.; Marty, N.; Claret, F.; Madé, B.; Giffaut, E. (2015) ThermoChimie database developments in the framework of cement/clay interactions. Appl. Geochem. 55, 95–107. https://doi.org/10.1016/j.apgeochem.2014.12.006 |
Figure 1. Photomicrographs of ZVB. a) Well-developed zeolite-rich zone (XN). b) Fluidal texture (arrows) in a volcanic glass-rich sector (//N). c) General texture of ZVB with fragments of zeolitized and partially altered volcanic glass (//N). d) Detail of a devitrified, altered sector in ZVB. Radial fibrous zeolites in a partially crystalline fine-grained mass can be observed (circle, XN). (z: zeolite-rich sector; v: volcanic glass-rich sector; c: clasts of ZVB).