Interpretation of petrographic anisotropy in ornamental granites based on P wave velocity measurements
L. Callejaa*, V. G. Ruiz de Argandoñaa, N. Sánchez-Delgadob, A. Setiéna
a. Department of Geology, Oviedo University, (Oviedo, Spain)
b. Granite Technology Centre Foundation of Galicia, (O Porriño, Spain)
* lcalleja@uniovi.es
| |
ABSTRACT
The existence of a possible anisotropy, determined by the orientation of any mineral or by microcrack network in granite rock, isn´t easily detected by the naked eye. Five granitic rocks from Galicia (Spain), namely Albero, Gris Alba, Gris Mondariz, Rosa Porriño and Traspielas, were characterized petrographically by means of textural and mineralogical studies, using optical polarizing microscopy, and fractographic studies were carried out under scanning electron microscopy. Longitudinal wave propagation velocity was measured in three orthogonal directions on cubic samples, oriented according to rift surface (known in quarry works like the preferential partition surface visible in the blocks). Vp was measured on dry and water saturated samples. All the dry samples showed an anisotropic behaviour of Vp. Models of microcrack network distribution and possible mineral grain orientation were developed based on the obtained data.
|
| |
RESUMEN
Interpretación de anisotropías petrográficas en granitos ornamentales basada en la medida de la velocidad de las ondas P. La existencia de una posible anisotropía originada por orientación de minerales y/o redes de microfisuración en rocas graníticas no es fácilmente detectable a simple vista. Cinco rocas graníticas de Galicia, denominadas comercialmente Albero, gris Alba, gris Mondariz, rosa Porriño y Traspielas, se caracterizaron petrográficamente, mediante estudios texturales y mineralógicos utilizando microscopía óptica de polarización, realizándose también estudios fractográficos bajo microscopía electrónica de barrido. Se midieron las velocidades de propagación de las ondas longitudinales (Vp) en tres direcciones ortogonales en muestras cúbicas orientadas según el rift (denominado así en cantería como la superficie preferente de partición). Vp se midió en muestras secas y saturadas. Todas las muestras secas mostraron un comportamiento anisótropo de Vp. A partir de los datos obtenidos se han interpretado las redes de distribución de microfisuras y la orientación de minerales.
|
1. INTRODUCTIONTOP
This work completes the brief publication of preliminary results (1) corresponding to a subsidized research project (MINECO-13, see section of acknowledgments); within it, the existence of possible textural and/or mineralogical anisotropies was determined by measuring the ultrasound velocities (the primary or longitudinal wave (P-wave) velocity, (Vp)). The characterization of the microcrack network of granitic rocks is very important to assess their physical and mechanical behaviour. The origin of microcrack networks generally lays in crystallization or emplacement processes, which may affect the entire rock volume due to magmatic flow during cooling or may be more localized, for example at the pluton borders or due to regional tectonic processes; decompression due to erosion can also be the source of microcracking (2). Contraction during the cooling process may lead to the formation of microcrack networks without any preferential directions. These are characterized by their density and orthogonal disposition, the degree of which is a function of the degree of contraction; some authors (3, 4) studied these large-scale anisotropies in relation with the best cutting direction in granite quarries.
Detection of textural anisotropy in rocks (i.e. orientation of minerals and/or microcracks) often represents a challenge in petrographic studies. Microscopic techniques (such as polarizing microscopy, fluorescence microscopy or scanning electron microscopy) are commonly applied to the study of microcracks or low orientation grade of one or more mineral phases because these features may be well below the detection range of macroscopic methods.
Dynamic properties of the rock can also be assessed by measurement of high frequency wave (ultrasound) velocity and the study of the wave properties when travelling through the material. The many advantages of these techniques include their non-destructive nature, their easy applicability both in field and in laboratory, and that they provide information about the existence of anisotropies as well as, indirectly, about other rock properties (i.e. Young’s modulus) of the material.
Some petrographic characteristics such as crystal shape and size, mineralogy, weathering degree, rock density and porosity, and existence of anisotropies, joints and microcracks, have been analyzed using P and S wave velocities (5). Our work falls into line with published studies of several other authors. Barton (6) gives an extensive summary of the topic. Sousa et al. (7) studied the influence of fissuration on the physico-mechanical properties (including Vp) of nine Portuguese ornamental granites, while Río et al. (8) established a negative correlation between the accessible porosity and the compressive strength and wave velocity of granites from Extremadura (Spain). Freire-Lista and Fort (9) is a very interesting paper about this approach microcrack study of building granitic rocks.
The relationship between foliation due to oriented micas, microcracks and P- and S-wave velocity in gneissic rocks were the subject of Kern et al. (10), Kern and Mengel (11) and Vázquez et al. (12) found a linear correlation between fractographic characteristics, capillarity and wave velocities in granites. Wang et al. (13) published similar results about P-wave velocity and permeability and fracture density in coal samples. Other authors also published studies on the relationship between P- and S-wave velocities, orientation and crack density (14). In a study of anisotropy planes versus P-wave velocity on spherical samples, Louis et al. (15) observed that the wave velocity was the highest in the direction of the intersections of anisotropic planes, which agreed with the results that (16) obtained in their study of the influence of microfissural anisotropy on the fracture toughness anisotropy of Barre granite. The determination of the anisotropy behaviour of granites can be also important regarding their durability (17, 18) when used as building materials. Almost all the physical properties (mechanical behaviour, porosity, water absorption, wave propagation, etc) are directional and can vary depending on the isotropy of the materials in general (and also on the rocks particularly) therefore there may be preferred directions in wich the alteration processes progress more rapidly, conditioning the overall durability.
Phyllosilicate minerals appear with a preferred orientation in several rock types and determine their anisotropic behavior. Godfrey et al. (19) studied the degree of anisotropy due to microcracks and mineral orientation of schist core samples by measuring the compressional and shear waves up to pressures of 1 GPa. The obtained results were applied to model crustal anisotropy. Cholach et al. (20) analyzed ultrasonic laboratory measurements of anisotropy of schists and shales and concluded that “relative to the muscovite aggregates the S-wave anisotropy decreases more slowly with greater orientation disorder than the P-wave anisotropy”.
Other rock-forming minerals can also induce anisotropy in rocks. Ji et al. (21) found seismic anisotropy in basic igneous rocks (layered mafic intrusions) with a high percentage of plagioclase. The anisotropy was due to the plagioclase orientation caused by magma flow during cooling. Even at a larger scale, the anisotropy in the Earth’s crust is most likely caused by textural elements formed by deformation events (i.e. preferred grain orientations, preferred structural orientations or microcracks). Kern et al. (22), Karlquist et al. (23) and Ong et al. (24) argue that velocity anisotropy results can also be used to give insight on the anisotropy type, for example whether it is shape, lattice preferred, or due to microcracks.
Sun et al. (25) studied the influence of experimental confining pressure in the behaviour of Vp of deep borehole core samples and their surface equivalents finding that Vp values are always higher in core samples independently of the applied confining pressure. They interpret this behaviour as due to the influence of orientations, aspect ratios, and filling minerals of microcracks.
2. METHODOLOGYTOP
In the present paper, we describe a methodology to assess possible anisotropies and their nature (i.e. if they are mineralogical and/or due to microcrack networks). The relationships between the primary or longitudinal wave (P-wave) velocity and some petrographic characteristics of five granitic rocks were studied in samples collected in quarries. 3-D qualitative graphical interpretations were developed contrasting the petrographic observations with the wave propagation data. They revealed information about both mineralogical and microfissural anisotropies. Water saturation was also considered as a basic parameter, because it has an influence on P-wave propagation but not on S-waves. Therefore, P-wave velocities were measured on both dry and wet samples.
Five ornamental granites from the SW Galicia (in NW Spain), namely Albero, Gris Alba, Gris Mondariz, Rosa Porriño and Traspielas (Figure 1) (26), were studied in the present paper. Cubic samples of 10 cm in size were cut from larger blocks, after a systematic random sampling. We based the orientation of the samples on the surface known as the “rift” in quarry works (which is the preferential partition surface visible in the blocks). This side of every sample was marked as surface F and the orthogonal surfaces were marked as H and T, respectively. The respective perpendicular directions to these faces are f, h and t (Figure 2).
|
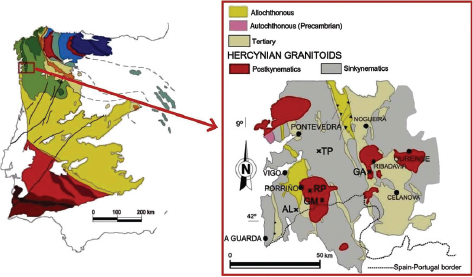 Figure 1. Left: Simplified geological map of Spain and Portugal; right: Detailed geological map of the SW zone of Galicia showing where the studied rocks were collected. Al: Albero; GA: Gris Alba; GM: Gris Mondariz; RP: Rosa Porriño; TP: Traspielas. The crosses indicate the location of the quarries. Figure 1. Left: Simplified geological map of Spain and Portugal; right: Detailed geological map of the SW zone of Galicia showing where the studied rocks were collected. Al: Albero; GA: Gris Alba; GM: Gris Mondariz; RP: Rosa Porriño; TP: Traspielas. The crosses indicate the location of the quarries.
|
|
|
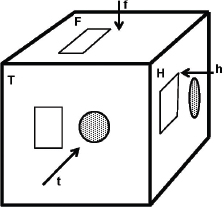 Figure 2. Sketch showing H, T and F faces and h, t and f directions. Orientation of the thin sections (squares) and cylindrical samples (circles) for petrographic studies. Figure 2. Sketch showing H, T and F faces and h, t and f directions. Orientation of the thin sections (squares) and cylindrical samples (circles) for petrographic studies.
|
|
Petrographic studies (optical polarizing microscopy -Zeiss Universal, magnification between x10 and x1000) including modal analysis were performed on standard thin sections. No dye is necessary in this particular type of study due to the grain size of the minerals that allows them to be identified by optical polarizing microscopy. Polished cylindrical samples, 25 mm in diameter, were used for the quantification of microcrack density under scanning electron microscopy (JEOL 6610LV with microanalysis). To determine the alteration degree of minerals, only the feldspars were considered since this mineral is the more abundant of these types of rocks. Quartz is not never alterated, only fracturated. The biotite is in low percentages and their alteration in not statistically representative. The microcrack density in both studied surfaces (H and T) was measured with the aid of a stereological grid superimposed on the images (Figure 3). On each sample, around 20 different screens were studied following a diametral line. 2.5 mm at the beginning and at the end of the line were discarded. Samples were cut with diamond tools to minimize the introduction of possible artefacts. Keep in mind that no one can guarante that a specific crack, is or isn’t an artefact, that is why there sould be a statistical study using a minimum numbrer of samples to minimize error; the margin of 2.5 mm is to minimize any influence originated in te preparation of the samples. These values, in terms of number of intersections of microcrack traces per mm of the grid, are summarized in Table 2. Before the petrographic studies, microcrack density measurements were conducted taking into consideration the results revealed by the previous ultrasonic characterization, because we considered that results obtained on F faces are similar to one of the other two (Table 3, Vp dry and water saturated values).
|
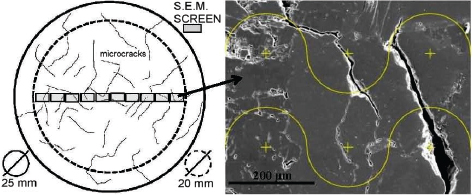 Figure 3. Left: Cylindrical sample (25 mm diameter) for microcrack study under SEM; each square is the area of the SEM screen. Right: An example showing the stereological grid superimposed on a SEM image of Albero granite. Figure 3. Left: Cylindrical sample (25 mm diameter) for microcrack study under SEM; each square is the area of the SEM screen. Right: An example showing the stereological grid superimposed on a SEM image of Albero granite.
|
|
Table 1. Modal composition of the studied rocks.
| % vol. |
Albero |
Gris Alba |
Gris Mondariz |
Rosa Porriño |
Traspielas |
| Quartz |
34.64±6.75 |
34.21±6.20 |
35.39±7.10 |
35.03±8.83 |
34.52±3.61 |
| Plagioclase |
7.21±3.11 |
13.92±4.43 |
18.02±6.01 |
14.99±5.78 |
22.88±5.78 |
| Weathered Plg. |
3.04±0.68 |
1.64±0.93 |
1.40±0.53 |
1.73±0.23 |
1.84±0.34 |
| K-feldspar |
36.42±7.2 |
37.98±6.41 |
37.54±5.98 |
43.33±8.67 |
23.31±3.57 |
| Weathered K-felds |
7.39±1.52 |
1.54±0.39 |
0.68±0.15 |
1.24±0.29 |
3.43±0.37 |
| Plg+K-felds |
54.06±17.08 |
55.08±12.36 |
57.64±11.59 |
61.29±15.98 |
51.46±3.19 |
| Biotite |
3.15±0.30 |
3.42±0.34 |
6.52±0.67 |
3.11±0.29 |
2.54±0.23 |
| Muscovite |
7.55±0.81 |
7.29±0.73 |
0.00 |
0.00 |
10.71±0.95 |
Table 2. Linear microcrack density in the H and T planes, open porosity and density values of the studied rocks.
| |
Albero |
Gris Alba |
Gris Mondariz |
Rosa Porriño |
Traspielas |
| H |
T |
H |
T |
H |
T |
H |
T |
H |
T |
| Microcracks/mm |
1.76
±0.25 |
2.25
±0.87 |
1.09
±0.16 |
1.21
±0.10 |
0.62
±0.26 |
0.69
±0.09 |
1.00
±0.20 |
1.11
±0.32 |
3.25
±0.86 |
3.42
±0.52 |
| T/H |
1.28 |
1.11 |
1.11 |
1.11 |
1.05 |
| Open Porosity (%) |
3.9±0.1 |
0.9±0.02 |
0.7±0.02 |
0.7±0.01 |
3.6±0.2 |
| Density (kg/m3) |
2545±4 |
2630±1 |
2640±13 |
2600±2 |
2560±4 |
Table 3. Velocities of P wave of the studied rocks. VP measured on dry and water saturated samples.
| |
Albero |
Gris Alba |
Gris Mondariz |
Rosa Porriño |
Traspielas |
| Vp (m/s) dry |
| h |
2281±133 |
4863±68 |
4535±72 |
5354±45 |
2295±37 |
| t |
3269±136 |
3981±112 |
5050±113 |
5152±83 |
2634±64 |
| f |
3259±151 |
4707±76 |
4903±75 |
4391±81 |
1945±52 |
| Vpmax/Vpmin |
1.43 |
1.22 |
1.11 |
1.22 |
1.35 |
| Vp (m/s) sat. |
| h |
4904±128 |
5685±106 |
6243±123 |
6203±47 |
4767±96 |
| t |
5079±136 |
5234±121 |
6370±141 |
6073±86 |
4803±115 |
| f |
5050±98 |
5454±117 |
6045±184 |
5905±143 |
4485±104 |
| Vpmax/Vpmin |
1.01 |
1.09 |
1.05 |
1.05 |
1.07 |
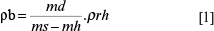
The apparent density and the open porosity were measured following (27). P wave velocity in the mentioned directions (i.e. f, h and t) was measured following (28). Six cubes, 10 cm in edge, were used for all the experiments. For density and porosity measurements, the following standard procedure was used: Samples were dried at 70±5ºC until constant mass (that is, when the difference between two consecutive measurements is less than 1% of the mass). This is lower temperature than indicated by the standard: 110±5ºC. Others authors (29 - 33) have shown that the thermal microfissuration threshold of granitic rocks can be lower than 110ºC, even close to 70ºC (29). After cooling down to laboratory temperature, they were weighed (md) and introduced into a vacuum vessel, to a vacuum of 2.0±0.7kPa for 2±0.2h. Water was introduced into the vessel, while keeping the vacuum, until the samples were fully covered; then, the vacuum was broken and the samples remained in the water for another 24±2h. Afterwards, the samples were weighed in saturated (ms) and hydrostatic (mh) conditions. Apparent density (ρb) was calculated according the following Equation [1]:
ρrh being the water density
Open porosity (p0) was calculated after the Equation [2]:
P-wave velocity tests were carried out using a PANAMETRICS- NDT model 5077 PR Squarewave pulser-receiver. Transmitter and receiver transducers of 1 MHz frequency were used. Measurements were made at the geometrical center of opposite planes on the samples used for the density and porosity tests.
For a better interpretation of the results and for rock anisotropy modeling, two rock quality indexes, IQ (34) and IF (35), were calculated (Table 4). Using ultrasonic velocities of minerals published by Carmichael (31) and the volumetric mineralogical composition determined in this study, the IQ quality index proposed by Tourenq et al. (34) was calculated applying the following Equation [3]:
Table 4. IQ values (calculated for dry samples) and IF values of the five rocks in the three studied directions.
| |
Albero |
Gris Alba |
Gris Mondariz |
Rosa Porriño |
Traspielas |
| Average Vp (m/s) |
5824 |
6013 |
5863 |
5854 |
5898 |
| IQ (%) |
| h |
39.2 |
82.6 |
77.3 |
91.5 |
38.9 |
| t |
56.1 |
67.7 |
86.1 |
88.0 |
44.7 |
| f |
56.0 |
80.4 |
83.6 |
75.0 |
33.0 |
| IF (%) |
| h |
52.4 |
14.7 |
19.6 |
8.7 |
53.3 |
| t |
38.1 |
28.5 |
13.6 |
10.5 |
48.6 |
| f |
38.4 |
17.7 |
13.9 |
20.8 |
59.2 |
where
VPexp: measured velocity (m/s)
VPm: average velocity of each mineral (36) (m/s)
Xm: volume percentage of each mineral (%).
IQ quantifies the relationship between the “perfect rock” (without discontinuities, anisotropies or alterations) and the “real rock”, based only on P wave velocities in dry samples. From this value, we can know the degree of ‘alteration’ of our rock as compared to a sound one. On the other hand, the index of microcracks (IF) of Delgado Rodrigues (35) takes into account the P-wave velocities both in dry and water saturated samples as compared to the theoretical velocity of the non-fissured rock estimated from the typical velocity and the volume percentage of each mineral (ΣVpm.Xm). Moreover, IF takes into account the dry and saturated conditions by introducing the water and the air Vp in the Equation [4].
where
VPc: theoretical P-wave velocities (m/s) that is ΣVPm.Xm
VPsat: P-wave velocities of the samples in water saturated conditions (m/s)
VPdry: P-wave velocities of the samples in dry conditions (m/s)
The P-wave velocities in water and air are 1500 and 340, respectively, in m/s.
Both indexes (i.e. IQ and IF) contribute to the development of more complete interpretation of the rock petrographic characteristics.
3. RESULTS AND DISCUSSIONTOP
According to the modal analysis, routinely used for petrographic classification (37) four of the studied rocks (namely Albero, Gris Alba, Gris Mondariz and Rosa Porriño) are syenogranites and the fifth one
(namely Traspielas) is a monzogranite (Table 1).
According to the obtained data, there is no evident relationship between the open porosity and the linear crack density (LCD)
values (Table 2). This is probably because the crack density measurement takes into account either isolated (or closed) and open microcracks.
Moreover, microcrack aperture is not considered, whereas this value has a significant influence on porosity. Evidently, rocks
with the same linear crack density, but different crack aperture, will have different porosities (higher values when high
crack aperture). This occurs with the open porosity and microcrack linear density values (Table 2) of Albero granite (open porosity 3.9% and microcrack density 1.76-2.25 μc/mm) and Traspielas granite (open porosity 3.6%
and microcrack density 3.25-3.42 μc/mm) due to the larger crack aperture of the Albero granite microcrack network. Table 3 presents the ultrasonic velocity values of the studied granites. Values for IQ and IF indexes are shown in Table 4. Rocks of higher quality (i.e. with no microcracks) have an IQ of 100 and the IF of non-fissured rocks would be 0.
Several of the aforementioned authors carried out studies about the anisotropic behaviour of different rock types and their
relationship with the wave propagation velocities variations and another physical property. Specifically to Spanish granitic
rocks, some studies can be seen in, for example, (1, 7-9, 12) and specially in Fort et al. (17); its results are partly of application and are related to those obtained by us that are presented here.
It is necessary to remember that density values have an inverse relationship with those of porosity (directly related to the
microcracks percentage –LCD- in this research paper). The interpretations made from now on to porosity or LCD are also explained
by the variation in density, whose experimental determination is also simultaneous to that of porosity (see (27) and Equations [1] and [2]).
3.1. Albero GraniteTOP
This rock is slightly altered as shown by the partial oxidation around biotite crystals (Figure 4). The texture is allotriomorphic with a medium grain size of 0.3 mm to 9 mm. The mode value is around 3 mm.
|
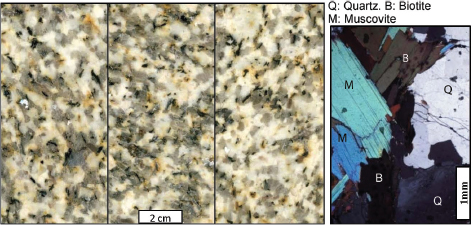 Figure 4. Macroscopic (F-T-H faces) and microscopic aspect (polarized light, NX) of Albero. Figure 4. Macroscopic (F-T-H faces) and microscopic aspect (polarized light, NX) of Albero.
|
|
The rock forming minerals are the following:
| – |
K- feldspar: allotriomorphic crystals are between 0.6 mm and 9 mm in size (mode at 3 mm). Most of them are microcline with albite-pericline twinning and, occasionally, Carlsbad twins. Orthoclase was also observed (microcline/orthoclase ratio is 80/20). Both are slightly altered (around 17% of area). |
| – |
Quartz: allotriomorphic crystals form irregular shaped aggregates of up to 15 mm size with straight boundaries. The aggregates are composed by individual particles of 0.05 to 6 mm in size (mode at 2 mm) with irregular grain boundaries. The crystals show - some times weak - undulatory extinction. |
| – |
Plagioclase (An25-28): allotriomorphic crystals have occasional subidiomorphic tendencies. Grain size is between 1 and 6 mm with the mode at 2 mm. Similarly, to the potassium feldspars, the form of larger crystals is usually more regular. Polysynthetic twins are a common feature. The plagioclase grains are partially or completely altered into sericite (degree of sericitation is around 30%). |
According to both the IQ and IF values, the microcrack family with the highest density of the Albero granite is perpendicular to the h direction. The orthogonal families of microcracks have lower density values, similar in the t and f directions. There is a marked anisotropy in the P-wave velocity values of the Albero granite when measured on dry samples, showing much higher values in the t and f directions than in the h direction. This again proves that the microcrack trace density is lower in planes parallel to H (Figure 5), which suggests the presence of other less important microcrack families, perpendicular to t and f directions. The similar wave velocity values in the three directions, when measured on water saturated samples, reveal the absence of mineralogical anisotropy, when Vp is similar in the 3 spacial directions there is no anisotropy. In the case of this rock, this is what happens in the saturated samples but not in the dry samples, where you see different values of Vp, this can only indicate fractographic anisotropy. When contrasting velocity data with the microcrack density values we can say that microcracks are markedly higher in the T plane. The Vp values of the water saturated samples are quite similar in the h, t and f directions, so it seems that there is no significant mineral anisotropy.
|
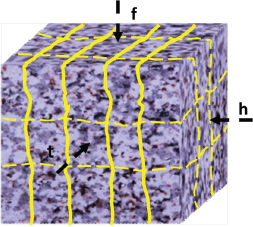 Figure 5. Model of the microcrack network proposed for the Albero granite. Solid lines: orientation of principal microfissuration; dashed lines: orientation of minor microfissuration. Figure 5. Model of the microcrack network proposed for the Albero granite. Solid lines: orientation of principal microfissuration; dashed lines: orientation of minor microfissuration.
|
|
3.2. Gris Alba GraniteTOP
This rock has a fine-grained, granular, panallotriomorphic texture. Grain size varies between 0.1 and 7 mm, and the mode is at 2 mm (Figure 6). Cracks with very small apertures can be observed mostly in quartz and potassium feldspar grains. These cracks are mostly of intracrystalline nature although, occasionally, they cross grain boundaries.
|
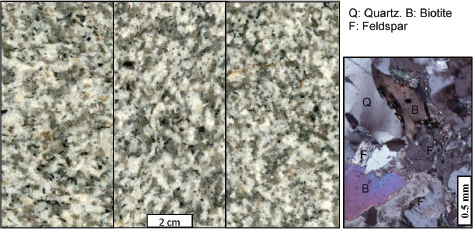 Figure 6. Macroscopic (F-T-H faces) and microscopic aspect (polarized light, NX) of Gris Alba. Figure 6. Macroscopic (F-T-H faces) and microscopic aspect (polarized light, NX) of Gris Alba.
|
|
The rock forming minerals are:
| – |
Quartz: allotriomorphic crystals with a size range between 0.2 and 7 mm. The most common grain size is 2 mm. Grains show well developed undulatory extinction. |
| – |
Potassium feldspar: most grains are allotriomorphic, but larger ones tend to be subidiomorphic. Grain size ranges between 0.3 and 7 mm with the mode at 3mm. Most crystals are orthoclases – some of them showing Carlsbad twins -, while microcline scarcely appears (about 5% of all potassium feldspar grains). Microcline crystals have an average grain size of 1 mm and show allotriomorphic forms filling spaces of other mineral phases. Poorly developed perthite can be observed. Crystals are often altered into sericite. |
| – |
Plagioclase (An 24-26): grains are subidiomorphic with the grain size ranging from 0.5 to 5mm (mode at 1 mm). Smaller grains are more irregular than larger ones. Often the grains are either completely altered or their central core is altered leaving a thin sound rim behind. Thin albite twins and occasional, poorly developed pericline twins can be observed. Small muscovite inclusions are common and, in some cases, biotite inclusions of 0.3mm size were found in more developed crystals. |
| – |
Muscovite: grains usually have subidiomorphic form and laminar platy habit. Grain size ranges between 0.1 and 6mm, with the mode at 2 mm. Fluid inclusions and quartz inclusions can be found within the muscovite crystals. |
| – |
Biotite: grains are allotriomorphic. Biotite is less common and of smaller size than muscovite. Sizes vary between 0.3 and 3mm, with the mode at 0.5mm. They often contain inclusions of zircon with pleochroic halo and of opaque minerals. In some cases, they are partially or totally chloritized. |
| – |
Accessory minerals: zircon and opaque grains in biotites. |
IF and IQ values of the Gris Alba granite indicate that the microcrack family with the highest density is perpendicular to the t direction. There are small differences in the h and f directions, which could either mean that the microcrack surfaces are positioned at a low angle to the studied planes or that there is a slight mineral orientation in the rock. These two factors could even appear together. P-wave velocity is clearly anisotropic in the Gris Alba granite with similarly high values in
the h and f directions, and lower velocities in the t direction (h≥f>t, Table 3). The increment of Vp in water saturated samples as compared to dry samples is nearly double in the t direction, while it is lower and similar in the h and f directions. This, again, might be a proof of the existence of an orthogonal microcrack network with the highest microcrack density in the planes perpendicular to t. This, together with the different IF values in the h and f directions, corroborates the theory that the planes with more microcracks have a slightly oblique orientation to the f direction.
This granite has low microcrack density and accessible porosity due to the peculiarities of its microcrack network, which is characterized by rather isolated microcracks of small aperture; the high P-wave velocity given the similar mineralogical composition of the five rocks can confirm this. The linear microcrack density is higher in the T plane than in the H; moreover, Vp (both dry and saturated) is different in h, t and f directions. All of these results suggest that there are three orthogonal
systems of microcracks, the most important one of them is perpendicular to t, and that mineralogical anisotropy nearly perpendicular to the same direction is present. In accordance with this, we interpret a fissural anisotropy in which most of the fissures are oriented almost perpendicular to the t direction, slightly oblique to f and nearly parallel to the h direction (Figure 7). In water saturated samples, the velocity differences in the three directions are notably smaller than in dry samples, especially in the t and f directions. This data is in agreement with the proposed interpretation since the velocities increase when the voids are saturated by water. Additionally, we propose a mineralogical anisotropy slightly oblique to t and f to explain the different Vp in dry samples.
|
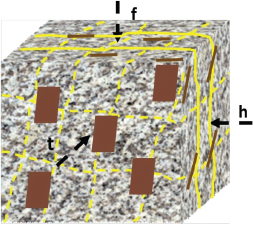 Figure 7. Model of Gris Alba granite showing the disposition of the microcrack and mineralogical anisotropies. Solid lines: orientation of principal microfissuration; dashed lines: orientation of minor microfissuration. Brown colour: mineralogical anisotropy. Figure 7. Model of Gris Alba granite showing the disposition of the microcrack and mineralogical anisotropies. Solid lines: orientation of principal microfissuration; dashed lines: orientation of minor microfissuration. Brown colour: mineralogical anisotropy.
|
|
3.3. Mondariz GraniteTOP
This granite has a hypidiomorphic heterogranular texture with medium to coarse grain size (0.5 – 20mm). Microcline, plagioclase and quartz grains are of especially large sizes. Fissures, which are more common in quartz than in other mineral phases, are short and discontinuous; they never exceed 10mm in length (Figure 8).
|
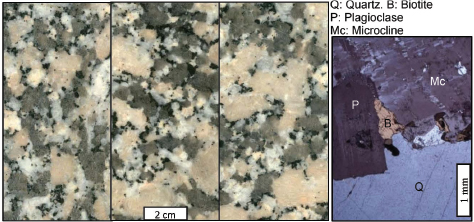 Figure 8. Macroscopic (F-T-H faces) and microscopic aspect (polarized light, NX) of Gris Mondariz. Figure 8. Macroscopic (F-T-H faces) and microscopic aspect (polarized light, NX) of Gris Mondariz.
|
|
The rock forming minerals are:
| – |
Quartz: present as isolated grains or forming polycrystalline aggregates of 20mm size, which are composed of allotriomorphic crystals between 0.2 and 1mm (mode at 0.5mm). They contain discontinuous and irregular fissures with apertures up to 0.2mm. In a few cases, idiomorphic muscovite inclusions of 0.3mm can be observed. Grains show a weak undulatory extinction. Contacts between quartz grains within the aggregates are irregular. |
| – |
Potassium feldspar: crystals are heterogranular and mostly allotriomorphic, with a grain size between 1 and 20 mm (mode at 10mm). They are dominantly of microcline composition showing the characteristic polysynthetic twinning according to the albite and pericline laws. In smaller quantities, orthoclase is also present. Both varieties show perthites. Some crystals contain quartz, plagioclase, biotite and even chlorite inclusions. |
| – |
Plagioclase (An 24-28): plagioclase crystals are somewhat smaller and more idiomorphic than microcline. Grain size is between 1 and 12mm, most grains are around 6mm. Smaller sized grains are contained by potassium feldspars and are not altered like larger plagioclase grains. Grains show zonation sometimes marked by mineral inclusions or zones of higher alteration degree, and almost all grains have altered central cores. |
| – |
Biotite: the subidiomorphic grains appear either as aggregates of up to 10mm size, formed by smaller crystals (0.5-3mm), or as isolated crystals, 2mm is the most common grain size. Biotite is also present as inclusions in plagioclase. Its grains are completely or partially chloritized, in which latter case the alteration follows the exfoliation of the original crystal. |
| – |
Accessory minerals: opaque phases and zircon. Almost exclusively within biotite grains. |
| – |
Secondary minerals: chlorite after biotite alteration and sericite after feldspar alteration. |
Gris Mondariz granite has a very low open porosity and low linear microcrack density, which is slightly higher in the T plane (about 10%). Vp measured on dry samples shows different values in the three directions (t>f>h), but in water saturated samples the f direction presents the lowest value. IQ values show a similar pattern to that observed in Vp values; IF is lower in
h than in the other directions (f=t). For all these reasons, we propose a model in which the principal microcrack network is parallel to H (perpendicular to h) with a secondary network parallel to F (perpendicular to f). In addition, mineralogical anisotropy slightly oblique to “f” is also considered (Figure 9).
|
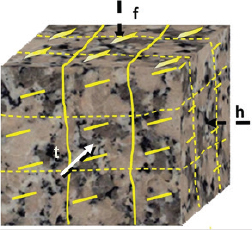 Figure 9. Model of Mondariz granite showing the disposition of the microcrack and mineralogical anisotropies. Solid lines: principal microfissuration orientation; thin dashed lines, minor microfissuration; planes: mineral anisotropy. Figure 9. Model of Mondariz granite showing the disposition of the microcrack and mineralogical anisotropies. Solid lines: principal microfissuration orientation; thin dashed lines, minor microfissuration; planes: mineral anisotropy.
|
|
3.4. Rosa Porriño GraniteTOP
The texture is hypidomorphic heterogranular with a medium to coarse grain size (1-15mm). Potassium feldspar grains are of the largest sizes, followed by plagioclase and quartz, while biotite and accessory mineral grains are smaller. Microcracks of preferential orientation cross all mineral grains although they are more developed in quartz grains (Figure 10).
|
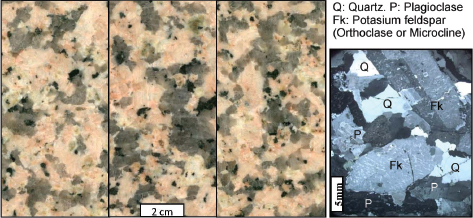 Figure 10. Macroscopic (F-T-H faces) and microscopic aspect (polarized light, NX) of Rosa Porriño. Figure 10. Macroscopic (F-T-H faces) and microscopic aspect (polarized light, NX) of Rosa Porriño.
|
|
The rock forming minerals are:
| – |
Quartz: it appears as allotriomorphic polycrystalline aggregates of approximately 10mm size formed by crystals between 0.5 and 5mm (mean at 3mm) with irregular grain boundaries. Undulatory extinction is often observed. The rock is characterized by continuous transgranular microcracks with apertures up to 3mm. |
| – |
Potassium feldspar: the grains are mostly of microcline composition and there is a smaller amount (approximately 20%) of orthoclase. The subidiomorphic to slightly allotriomorphic grains can reach 15mm in size; the minimum grain size is around 2mm and the mode at 10mm. Both orthoclase and microcline shows perthites (sometimes, small patches). The perthites are so altered that in most cases their twinning is undistinguishable. In contact zones towards plagioclase, poorly developed myrmekites can be observed. In larger grains, biotite, quartz and even plagioclase inclusions are common. These inclusions have approximately 0.5-1mm size. |
| – |
Plagioclase (An 25-30): the subidiomorphic grains are between 1 and 10mm in size (mode at 4mm). The inner, more Ca-rich, cores are usually altered, which makes their identification more difficult. Muscovite inclusions of sizes below 0.1mm can be observed. |
| – |
Biotite: it appears as very dark, idiomorphic to subidiomorphic grains and aggregates up to 1mm in size. Crystals between 0.1 and 0.6mm (mode at 0.5mm) form the aggregates. Biotite grains are altered partially or completely into chlorite. |
| – |
Accessory minerals: irregular muscovite crystals appear as inclusions in plagioclase. Zircon and opaque phases can form inclusions in biotite. |
| – |
Secondary minerals: the sericite is a weathering product of feldspars and the chlorite that of biotite. |
Rosa Porriño granite has low open porosity, but its bulk density is lower than that of Gris Alba and Gris Mondariz, which suggests the existence of closed porosity. This theory is also confirmed by the microcrack density values. Vp shows a significant anisotropy, Vp is lower in the f direction but, in saturated samples, it is very similar in t and f directions and slightly higher in h. IQ and IF results confirm these anisotropic characteristics. Therefore, we propose a model in which the principal microcrack network is oblique to F with a secondary network parallel to H, in addition to a mineralogical anisotropy also slightly oblique to F (Figure 11).
|
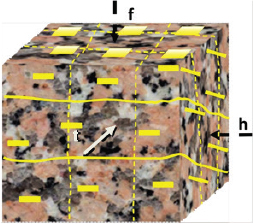 Figure 11. Model of Rosa Porriño granite showing the disposition of the microcrack and mineralogical anisotropies. Solid lines: principal microfissuration orientation; thin dashed lines, minor microfissuration; planes: mineral anisotropy. Figure 11. Model of Rosa Porriño granite showing the disposition of the microcrack and mineralogical anisotropies. Solid lines: principal microfissuration orientation; thin dashed lines, minor microfissuration; planes: mineral anisotropy.
|
|
3.5. Traspielas GraniteTOP
The rock texture is hypidiomorphic with fine to medium grain size. Rock forming mineral grains range between 0.1 and 10mm in size with the mode at 0.4mm (Figure 12). Mineral phases show a slight orientation, which is easier to detect by the naked eye than by microscope. The rock contains a large number of microcracks of different sizes, which are interconnected and cross almost all mineral phases, especially quartz and feldspar grains, although they cannot be detected in mica crystals.
|
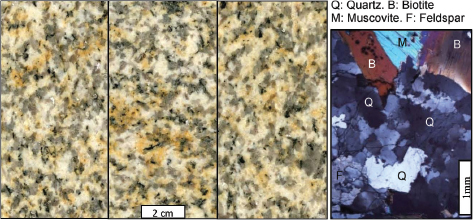 Figure 12. Macroscopic (F-T-H faces) and microscopic aspect (polarized light, NX) of Traspielas. Figure 12. Macroscopic (F-T-H faces) and microscopic aspect (polarized light, NX) of Traspielas.
|
|
The rock forming minerals are:
| – |
Quartz: it forms relatively rounded aggregates of 1 to 10 mm in size. The allotriomorphic crystals that compose the aggregates are between 1 and 6 mm in size and show very irregular contacts. Some isolated crystals of 0.5-4mm size (mode at 2.5mm) can also be found. All of them show undulatory extinction and are cut by a large number of microcracks that may reach 0.3mm in width. The smallest aperture size possible to detect by optical microscopy is 0.1mm. |
| – |
Potassium feldspar: the grains are allotriomorphic, their size ranges between 0.5 and 10mm, the most common size is 0.5mm. Larger grains have more subidiomorphic shapes. Most grains are of orthoclase composition, hardly any microclines can be found. Some of them show isolated perthites. They contain small muscovite, quartz and plagioclase inclusions of sizes between 0.2 and 1mm. Microcracks of orthogonal position are present. |
| – |
Plagioclase (An 28-32): the grains are subidiomorphic with a grain size range of 0.3 – 9mm (mode at 0.4mm). They appear as grains with twinning according to the albite law, as isolated grains or as aggregates. Quartz and muscovite inclusions are very common. |
| – |
Biotite: this mica type is less common than muscovite. The grains are subidiomorphic, with smaller grain size (0.2-7mm) with the mode at 4mm. Biotite usually appears in association with muscovite; they form aggregates together. Biotite grains contain zircon, apatite and opaque inclusions. |
| – |
Muscovite: its grains can reach 10mm in size (mode at 7mm) and are more idiomorphic than biotite grains. The two mica types appear together, except for the muscovite grains that appear within plagioclase crystals. This muscovite type is of smaller size and shows elongated or patchy morphologies. |
| – |
Accessory minerals: zircon and opaque minerals in biotite. |
| – |
Secondary minerals: sericite after feldspar alteration. |
In the Traspielas granite, we found a microcrack network almost parallel to the t direction and at angle to the h and f directions, based on the IQ values of the dry samples. Due to the experimental procedure (measurements were carried out only at the geometrical center of each sample), it is not possible to quantify the angles thus the model cannot be refined more exactly. Additionally, this rock is affected by mineral anisotropy clearly perpendicular to the f direction and almost parallel to the h and t directions. The marked anisotropy of the highly fissured Traspielas granite was also proved by the wave velocity measurements. Dry velocities are lower in the f direction than in the h and t directions, while the Vp increase in the water saturated measurements are quite different in the three directions (Vpf: ~130%, Vph: ~108% and Vpt: ~82%). To explain these results, we propose a model with high fissural anisotropy affecting the f direction and oblique to the plane formed by the t and h directions together with mineralogical anisotropy parallel to the F plane (Figure 13).
|
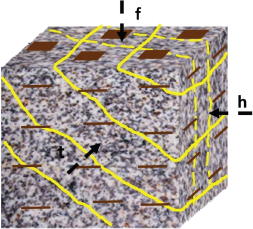 Figure 13. Model of Traspielas granite showing the disposition of the microcrack and mineralogical anisotropies. Solid yellow lines: orientation of principal microfissuration; dashed yellow lines: orientation of minor microfissuration. Brown colour: mineralogical anisotropy. Figure 13. Model of Traspielas granite showing the disposition of the microcrack and mineralogical anisotropies. Solid yellow lines: orientation of principal microfissuration; dashed yellow lines: orientation of minor microfissuration. Brown colour: mineralogical anisotropy.
|
|
4. CONCLUSIONSTOP
The microcrack network distribution and mineral grain orientation were interpreted based on data of longitudinal velocity (Vp) and calculated IQ and IF indexes. The results of the proposed interpretation and the petrographic studies are in good agreement. The Vp differences of the studied granites are due to differences in open microcrack percentage (open porosity), mainly. Mineral compositions are similar in the 5 studied rocks and the grain size is not expected to be significant in these cases. Oriented microcracks induce P-wave velocity anisotropy. This anisotropy decreases in water saturated samples, as after water saturation, Vp becomes quite similar in all directions when the microcrack network is isotropic (see Albero especially, but also Gris Alba, Gris Mondariz and Rosa Porriño). However, if measurement directions and the microcrack network are in an oblique position and there is preferential mineral orientation (e.g. micas in Gris Mondariz, Rosa Porriño and, especially, Gris Alba and Traspielas), Vp shows different values in each direction. This mineralogical anisotropy is the same both in dry and water saturated rocks and therefore the existence of a possible anisotropic orientation of minerals and microcrack networks in granitic rocks, not easily detected by the naked eye, can be demostrated by using non-destructive methods, such as Vp measurements. This method can be used to interpret anomalous behaviours of these rock types. The obtained results can be useful to decide the best cut directions in a quarry and to explain the different mechanical and other properties when these kinds of rocks are tested. Moreover, awareness of anisotropic behaviour can be determinant in the assessment durability of rocks used as building materials.
ACKNOWLEDGEMENTSTOP
This work was supported by the “Dirección General de Investigación Científica y Técnica del Ministerio de Economía y Competitividad” (Spain). (Project MINECO-13-CGL2012-33588).
REFERENCESTOP
| 1. |
Calleja, L.; Rodríguez-Rey, A.; Ruiz de Argandoña, V.G.; Sánchez-Delgado, N.; Camino, C. (2014) Textural anisotropies characterization of granitic rocks using P wave velocities. In: Rock Engineering and Rock Mechanics: Structures in and on Rock Masses. 173–177. Eurock Vigo. Taylor & Francis Group, London, (2014). |
| 2. |
Ziegler, M.; Loew, S.; Bahat, D. (2014) Growth of exfoliation joints and near-surface stress orientations inferred from fractographic markings observed in the upper Aar valley (Swiss Alps). Tectonophysics. 626, 1–20. https://doi.org/10.1016/j.tecto.2014.03.017. |
| 3. |
Yarahmadi, R.; Bagherpour, R.; Taherian, S.G.; Sousa, L.M.O. (2018) Discontinuity modelling and rock block geometry identification to optimize production in dimension stone quarries. Eng. Geol. 232, 22–33. https://doi.org/10.1016/j.enggeo.2017.11.006. |
| 4. |
Yarahmadi, R.; Bagherpour, R.; Khademian, A.; Sousa, L.M.O.; Almasi, S.N.; Esfahane, M.M. (2019). Determining the optimum cutting direction in granite quarries through experimental studies: a case study of a granite quarry. Bull. Eng. Geol. Environ. 78, 459–467. https://doi.org/10.1007/s10064-017-1158-5. |
| 5. |
Lama, R.D.; Vutukuri, V.S. (1978) Handbook of mechanical properties of rocks (Testing techniques and results). Vol. II. Trans Tech. Publications, (1978). |
| 6. |
Barton, N. (2007) Rock Quality, Seismic Velocity, Attenuation and Anisotropy. London: CRC Press. https://doi.org/10.1201/9780203964453. |
| 7. |
Sousa, L.M.O.; Suárez del Río, L.M.; Calleja, L.; Ruiz de Argandoña, V.G.; Rodriguez-Rey, A. (2005) Influence of microfractures and porosity on the physico-mechanical properties and weathering of ornamental granites. Eng. Geol., 77 [1–2], 153–158. https://doi.org/10.1016/j.enggeo.2004.10.001. |
| 8. |
Río, L.M. del; López, F.; Esteban, F.J.; Tejado, J.J.; Mota, M.; González, I.; San Emeterio, J.L.; Ramos, A. (2006) Ultrasonic characterization of granites obtained from industrial quarries of Extremadura (Spain). Ultrasonics. 44, Supplement, e1057–e1061. https://doi.org/10.1016/j.ultras.2006.05.098. |
| 9. |
Freire-Lista, D.M.; Fort, R. (2017). Exfoliation microcracks in building granite. Implications for anisotropy. Eng. Geol. 220, 85–93. https://doi.org/10.1016/j.enggeo.2017.01.027. |
| 10. |
Kern, H.; Mengel, K.; Strauss, K.W.; Ivankina, T.I.; Nikitin, A.N.; Kukkonen, I.T. (2008) Elastic wave velocities, chemistry and modal mineralogy of crustal rocks sampled by the Outokumpu Scientific Drill Hole: evidence from lab measurements and modeling. Phys. Earth Planet. Int.175 [3–4], 151–166. https://doi.org/10.1016/j.pepi.2009.03.009. |
| 11. |
Kern, H.; Mengel, K. (2011) P and S-wave velocities and velocity anisotropy of core samples from the Outokumpu 2500m crustal section: implications for the nature of seismic reflections. In: Geological Survey of Finland, Special Paper 51, 83–94. |
| 12. |
Vázquez, P.; Alonso, F. J.; Esbert, R. M.; Ordaz, J. (2010) Ornamental granites: Relationships between P-waves velocity, water capillary absorption and the crack network. Const. Build. Mater. 24 [12], 2536–2541. https://doi.org/10.1016/j.conbuildmat.2010.06.002. |
| 13. |
Wang, H.; Pan, J.; Wang, S.; Zhu, H. (2015) Relationship between macrofracture density, P-wave velocity and permeability of coal. J. Appl. Geophys. 117, 111–117. https://doi.org/10.1016/j.jappgeo.2015.04.002. |
| 14. |
Wang, X.-q; Schubnel, A.; Fortin, J.; Gueguen, Y.; Ge, H.-q. (2012) Vp/Vs ratio: dispersion and anisotropy effects in cracked rocks. Geophys. Res. Abst. 14, EGU2012, Vienna, Austria, 5733. |
| 15. |
Louis, L.; David, Ch.; Spaceek, P.; Wong, T.-f; Fortin, J.; Song, S.R. (2012) Elastic anisotropy of core samples from the Taiwan Chelungpu Fault Drilling Project (TCDP): direct 3-D measurements and weak anisotropy approximations. Geophys. J. Int. 188 [1], 239–252. https://doi.org/10.1111/j.1365-246X.2011.05247.x. |
| 16. |
Dai, F.; Xia, K.W. (2013) Laboratory measurements of the rate dependence of the fracture toughness anisotropy of Barre granite. Int. J. Rock Mech. Min. Sci. 60, 57–65. https://doi.org/10.1016/j.ijrmms.2012.12.035. |
| 17. |
Fort, R.; Varas, M.J.; Alvarez de Buergo, M.; Martin-Freire, D. (2011) Determination of anisotropy to enhance the durability of natural stone. J. Geophys. Eng. 8 [3], S132–S144 https://doi.org/10.1088/1742-2132/8/3/S13. |
| 18. |
Freire-Lista, D.M.; Fort, R. (2016). Causes of scaling on bush-hammered heritage ashlars: a case study—Plaza Mayor of Madrid (Spain). Environ. Earth Sci. 75, 932. https://doi.org/10.1007/s12665-016-5688-0 |
| 19. |
Godfrey, N.J.; Christensen, N.I.; Okaya, D.A. (2000) Anisotropy of schists: Contribution of crustal anisotropy to active source seismic experiments and shear wave splitting observations. J. Geophys. Res., 105 [B12], 27991-28007). https://doi.org/10.1029/2000JB900286. |
| 20. |
Cholach, P.Y.; Schmitt, D.R. (2006) Intrinsic elasticity of a textural transverserly isotropic muscovite aggregate: Comparisons to the seismic anisotropy of schists and shales. J. Geophys. Res. 111, B09410. https://doi.org/10.1029/2005JB004158. |
| 21. |
Ji, S.; Shao, T.; Salisbury, M.H.; Sun, Sh.; Michibayashi, K.; Zhao, W.; Long, Ch.; Liang, F.; Satsuwkawa, T. (2014) Plagioclase preferred orientation and induced seismic anisotropy in mafic igneous rocks. J. Geophys. Res. 119 [4], 8064–8088. https://doi.org/10.1002/2014JB011352. |
| 22. |
Kern, H.; Ivankina, T.; Nikitin, A.; Lokajícek, T.; Pros, Z. (2008) The effect of oriented microcracks and crystallographic and shape preferred orientation on bulk elastic anisotropy of a foliated biotite gneiss from Outokumpu. Tectonophysics. 457 [3–4], 143–149. https://doi.org/10.1016/j.tecto.2008.06.015 |
| 23. |
Karlqvist, R.; Lassila, I.; Hæggström, E.; Pesonen, L.J. (2012) Ultrasonic velocity anisotropy technique to enhance seismic surveys and ore prospecting. In: IEEE International Ultrasonics Symposium Proceeding. 2674–2677. https://doi.org/10.1109/ULTSYM.2012.0670. |
| 24. |
Ong, O.; Schmitt, D.R.; Kofman, R. (2015) Seismic anisotropy and elastic properties of a VTI medium. In: Third International Workshop on Rock Physics. Perth, Western Australia. |
| 25. |
Sun, S.; Ji, S.; Wang, Q.; Salisbury, M.; Kern, H. (2012) P-wave velocity differences between surface-derived and core samples from the Sulu ultrahigh-pressure terrane: Implications for in situ velocities at great depths. Geology. 40 [7], 651–654. https://doi.org/10.1130/G33045.1. |
| 26. |
Martínez Catalán, J.R.; Pérez-Estaún, A.; Bastida, F.; Pulgar, J.A.; Marcos, A. (1990) Structure. In: Dallmeyer R.D., Garcia E.M. (eds) Pre-Mesozoic Geology of Iberia. IGCP-Project 233 (Terranes in the Circum-Atlantic Paleozoic Orogens). Heidelberg, Berlin: Springer. https://doi.org/10.1007/978-3-642-83980-1_9. |
| 27. |
UNE-EN 1936 (2007) Natural Stone test methods. Determination of real density and apparent density of total and open porosity. European Committee for Standardization. (2007). |
| 28. |
UNE-EN 14579 (2007) Natural Stone test methods. Determination of sound speed propagation. European Committee for Standardization. (2005). |
| 29. |
Bauer, S.J.; Johnson, B. (1979) Effects of slow heating on the physical properties of the Westerly and Charcoal granites. In: Proc. 20th U.S. Symp. on Rock Mechanics, 12 pp. |
| 30. |
Ruiz de Argandoña, V.G.; Calleja, L.; Montoto, M. (1985) Determinación experimental del umbral de microfisuración térmica de la roca matriz o intact rock. Trabajos de Geología. 15, 299–306. |
| 31. |
Calleja, L.; Ruiz de Argandoña, V.G.; Rodríguez-Rey, A.; Montoto, M. (1987) Thermal microfissuration development in a granodioritic rock: A qualitative assesment by non destructive techniques. In: Sixth Meeting of the European Clay Groups,
Euroclay’ 87. 13–16. |
| 32. |
Calleja, L. (1991) Variación de propiedades físicas en rocas cristalinas sometidas a gradientes térmicos. Universidad de Oviedo, Servicio de publicaciones (1991). |
| 33. |
Ruiz de Argandoña, V.G. (1991) Estudio de la microfisuracion térmica mediante emisión acústica: interpretación petrográfica. Universidad de Oviedo, Servicio de publicaciones. |
| 34. |
Tourenq, C.; Fourmaintraux, D.; Denis, A. (1971) Propagation des ondes et discontinuités des roches. In: Proc. Int. Symp. Int. Soc. Rock Mech. |
| 35. |
Delgado Rodrigues, J. (1983) Studies of fissuration of rocks. G.P. Newsletter 4. In: Group petrography of the Icomos Stone Committee. 30–33. Strasbourg. |
| 36. |
Carmichael, R.S. (1989) Practical handbook of physical properties of rocks and minerals. FL: CRC Press, Boca Raton, Florida. (1989). |
| 37.. |
Le Maitre, R.W. (Ed.) (2002) Igneous rock. A classification and glossary of terms. Recommendations of the I.U.G.S. Cambridge University Press. (2002). https://doi.org/10.1017/CBO9780511535581. |